
Cubes
Every node in a Valsight model holds its values as a cube — a multi-dimensional data structure where each value is identified by its exact position across all relevant dimensions. Understanding what a cube is explains how functions behave, why operations produce the results they do, and what “maximum cube size” means in practice.
The Core Idea
How dimensions work explains how Valsight organizes data across dimensions. A cube is the actual structure that holds those values for each node.
In a spreadsheet, data lives in rows and columns. Adding a third axis requires a new sheet, a lookup formula, or a pivot — and the structure fragments as complexity grows. In Valsight, all values for a node exist inside a single cube: a multi-dimensional space where each axis is a dimension. A single value is located by its exact position across all dimensions at once.
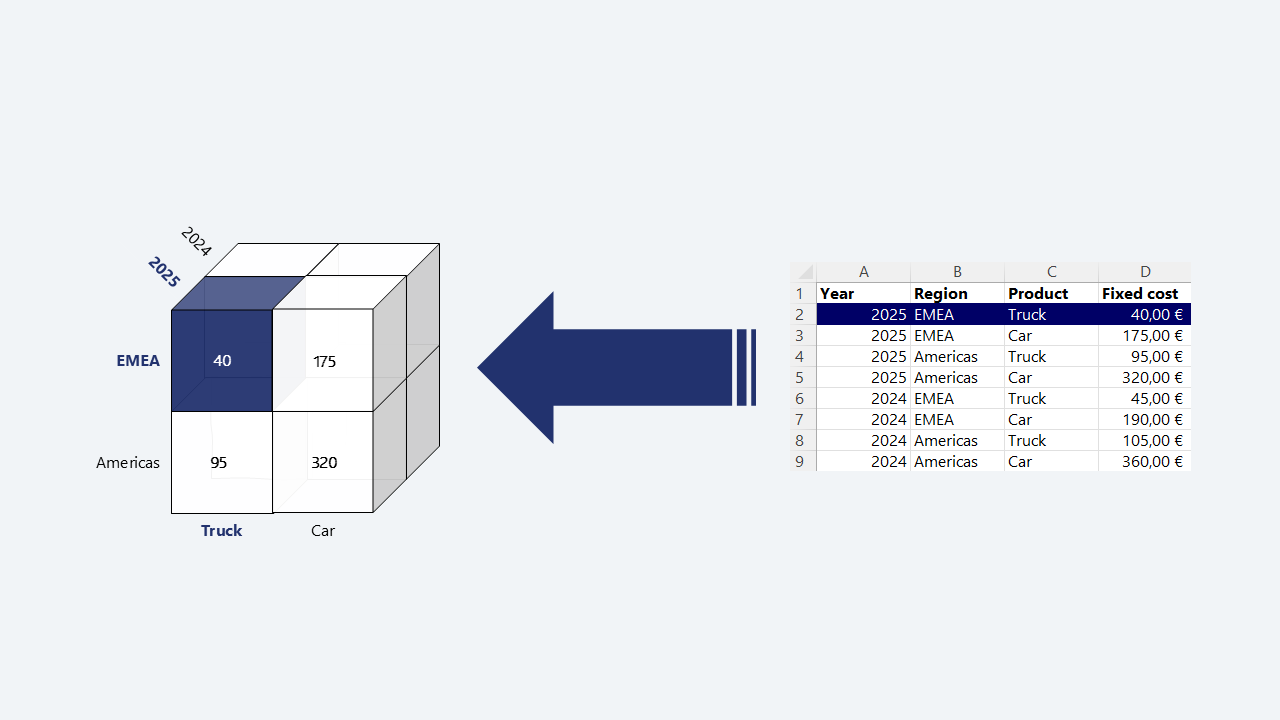
The flat table and the cube hold exactly the same data — just organized differently. A row like “Year = 2025, Region = EMEA, Product = Truck, Fixed Cost = 40 €” becomes a single point inside the cube, located at the intersection of those three axes.
This is not only a visual metaphor — it is the actual structure of every node’s output. When a formula calculates a result, the result is a cube. When a function filters, reshapes, or expands data, it operates on a cube and returns a cube with a defined shape. When the system warns about “maximum cube size,” it refers to the number of intersections in that result.
The geometric name is intentional: with two dimensions, the structure is a flat table. With three, it becomes a cube. With more, the same principles extend beyond physical visualization.
Key Components
Dimension — One axis of the cube (e.g. Time, Region, Product). See How dimensions work for levels, hierarchies, and structural rules.
Intersection — A single point in the cube, defined by one level value per included dimension. A value lives at exactly one intersection.
Cube size — The total number of intersections in a cube. In the worst case this equals the cross product of all level members across all dimensions; in practice, most real-world cubes are sparse.
Why This Matters
Because every node produces a cube, Valsight can apply operations consistently across any combination of dimensions — without requiring separate formulas or sheets for each view.
This enables:
Consistent aggregation — Values at any level can be rolled up without rebuilding logic. The hierarchy encodes the relationship once.
Predictable alignment — When two nodes are combined, alignment is always determined by their shared dimensions. There are no hidden joins or implicit matches.
Defined function behavior — Every function in Valsight has a defined effect on the cube’s shape. FILTER reduces it. ROLLUP aggregates it. IS_NA and EXPAND can fully expand it. Knowing a function’s shape behavior is central to using it correctly.
Diagnosable results — Most unexpected outputs trace back to a shape mismatch: the result is too aggregated, too granular, or unexpectedly expanded. Thinking in cubes makes these issues identifiable.
Understanding cube size also explains a class of performance constraints. Some functions — in particular IS_NA and EXPAND — create a fully expanded cube, generating a value for every possible intersection. When dimensions are large, this can produce a result that exceeds the configured maximum cube size. This is a structural consequence of the data model, not a bug.
Design Principles
Keep cubes as sparse as possible. Real-world models rarely need full cross products; prefer functions that preserve sparsity over those that expand it.
Understand the output shape of each function before using it. Every function either preserves, reduces, or expands the cube in a specific, predictable way.
When diagnosing unexpected results, check the shape first: is the output missing dimensions it should have, aggregated too broadly, or larger than expected?
A cube’s size grows multiplicatively with dimension members. Adding a new level or expanding a dimension can have significant downstream effects on calculations that reference it.
Example
The diagram above shows a Fixed Costs node with three dimensions: Year, Region, and Product.
The value at the intersection Year = 2025, Region = EMEA, Product = Truck is 40 €. The same cube also holds the value at every other intersection: EMEA / Car = 175 €, Americas / Truck = 95 €, Americas / Car = 320 € — all within the 2025 slice. The 2024 slice holds a separate set of values at the same region and product intersections (45 €, 190 €, 105 €, 360 € respectively).
A formula combining this cube with another node — for example, a volume node with the same dimensions — would align automatically along the shared axes. The result is a new cube with the same shape, unless a reshaping operation changes it.
If Fixed Costs is filtered to EMEA only using FILTER, the result is a smaller cube: same three dimensions, but only the EMEA intersections. If IS_NA is applied to check for missing values, the result is a fully expanded cube covering all Year × Region × Product combinations — whether or not data originally existed at that intersection.