
Grouping Assumption Effects in Bridges
In bridges, you are able to either show line-items of the same assumption separately or grouped.
This enables you to either see the effect of each line-item separately or see the effects combined for the assumption.
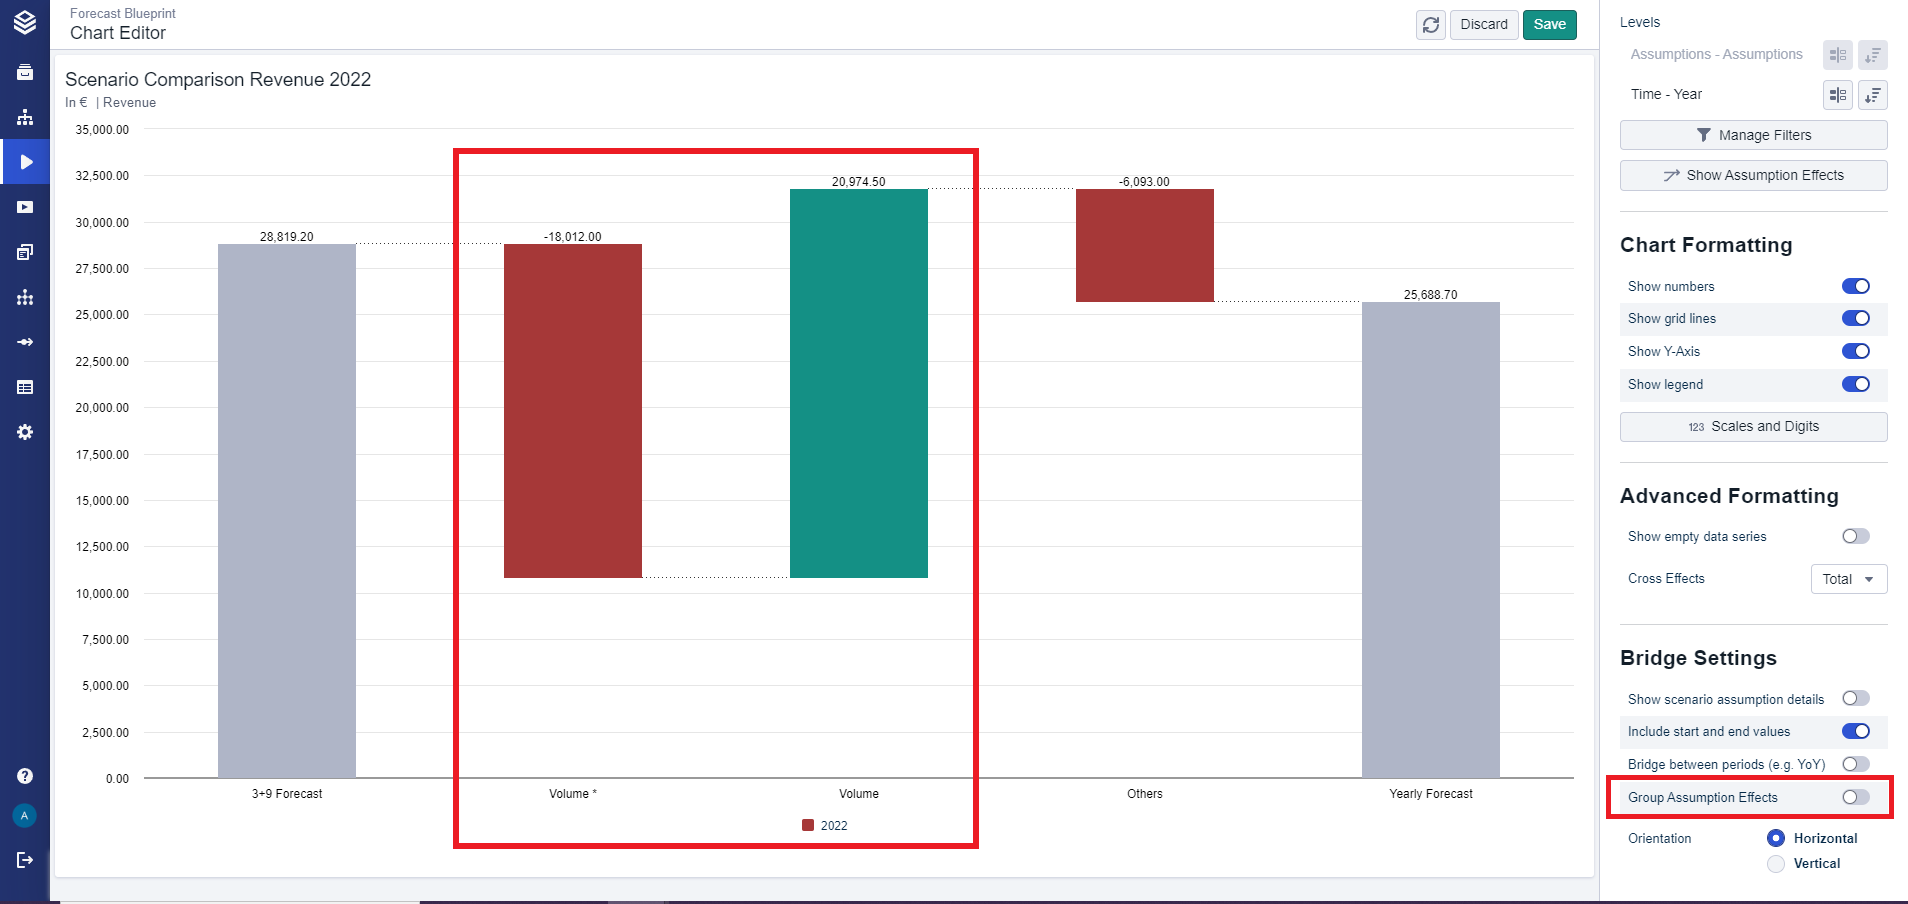
To change this setting, go to the “Bridge Settings” in the chart editor and use the toggle button for “Group Assumption Effects”.
Example:
In this first picture, you see two bars with the name “Volume” and the “Group Assumption Effects” toggle button is off.
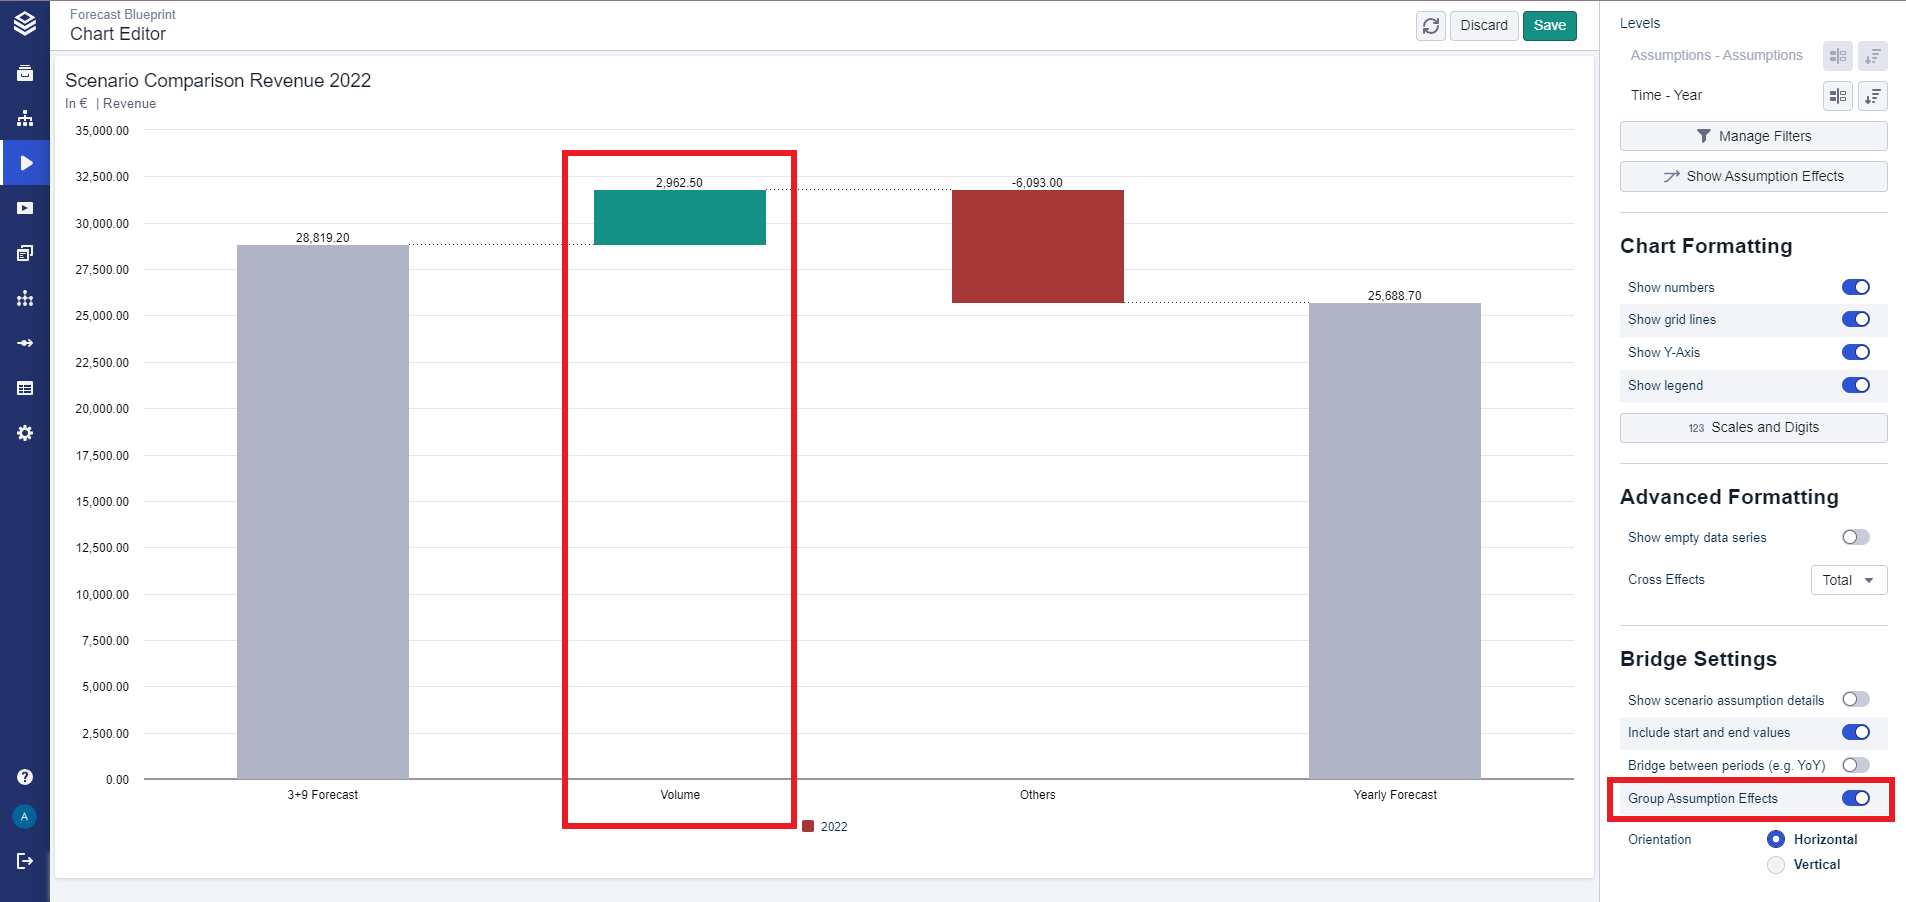
In this second picture, the “Group Assumption Effects” toggle button is on and the previous two separate bars have been combined into one grouped “Volume” bar.
Grouping Assumption Effects for Line Items
From version 6.5.0 onwards, the 'Group assumption effects' setting will also group variants into a single bar which occurs displaying line items with varying variants instead of assumptions as deltas in a bridge chart.