Input Tables
Input Tables bring simulation and visualization together in one place. With Input Tables, it is possible to directly modify data in the Workspace, instantly see the effects, and refine their assumptions without switching screens.
This feature makes scenario modeling faster, more intuitive, and seamlessly integrated into your workflow.
How to Set Up a Input Table
Open the Table Wizard
Click "+ Chart" in the Workspace.
Navigate to the "Simulations" category.
Select "Input Table".

Configure the Table
Choose a Line Item to edit.
Edit the Table title (optional).
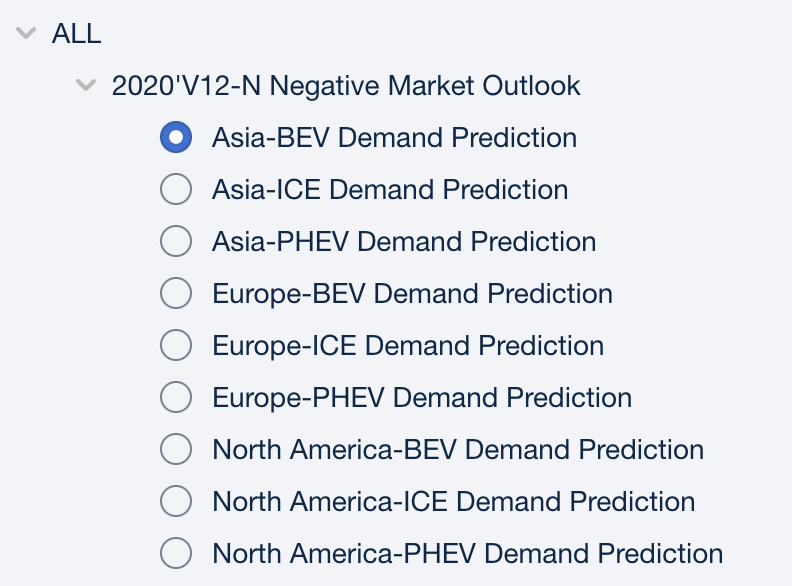
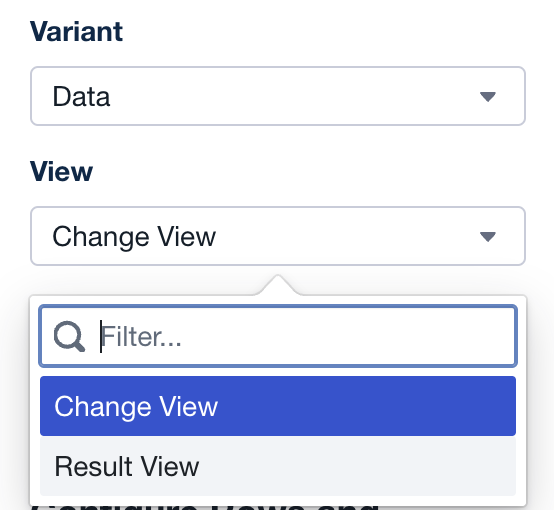
Select the variant you want to modify.
Choose between Change View or Result View.
Apply Filters (Optional)
If needed, apply filters to focus on relevant data.
A filter icon will appear when hovering over a filtered Table.
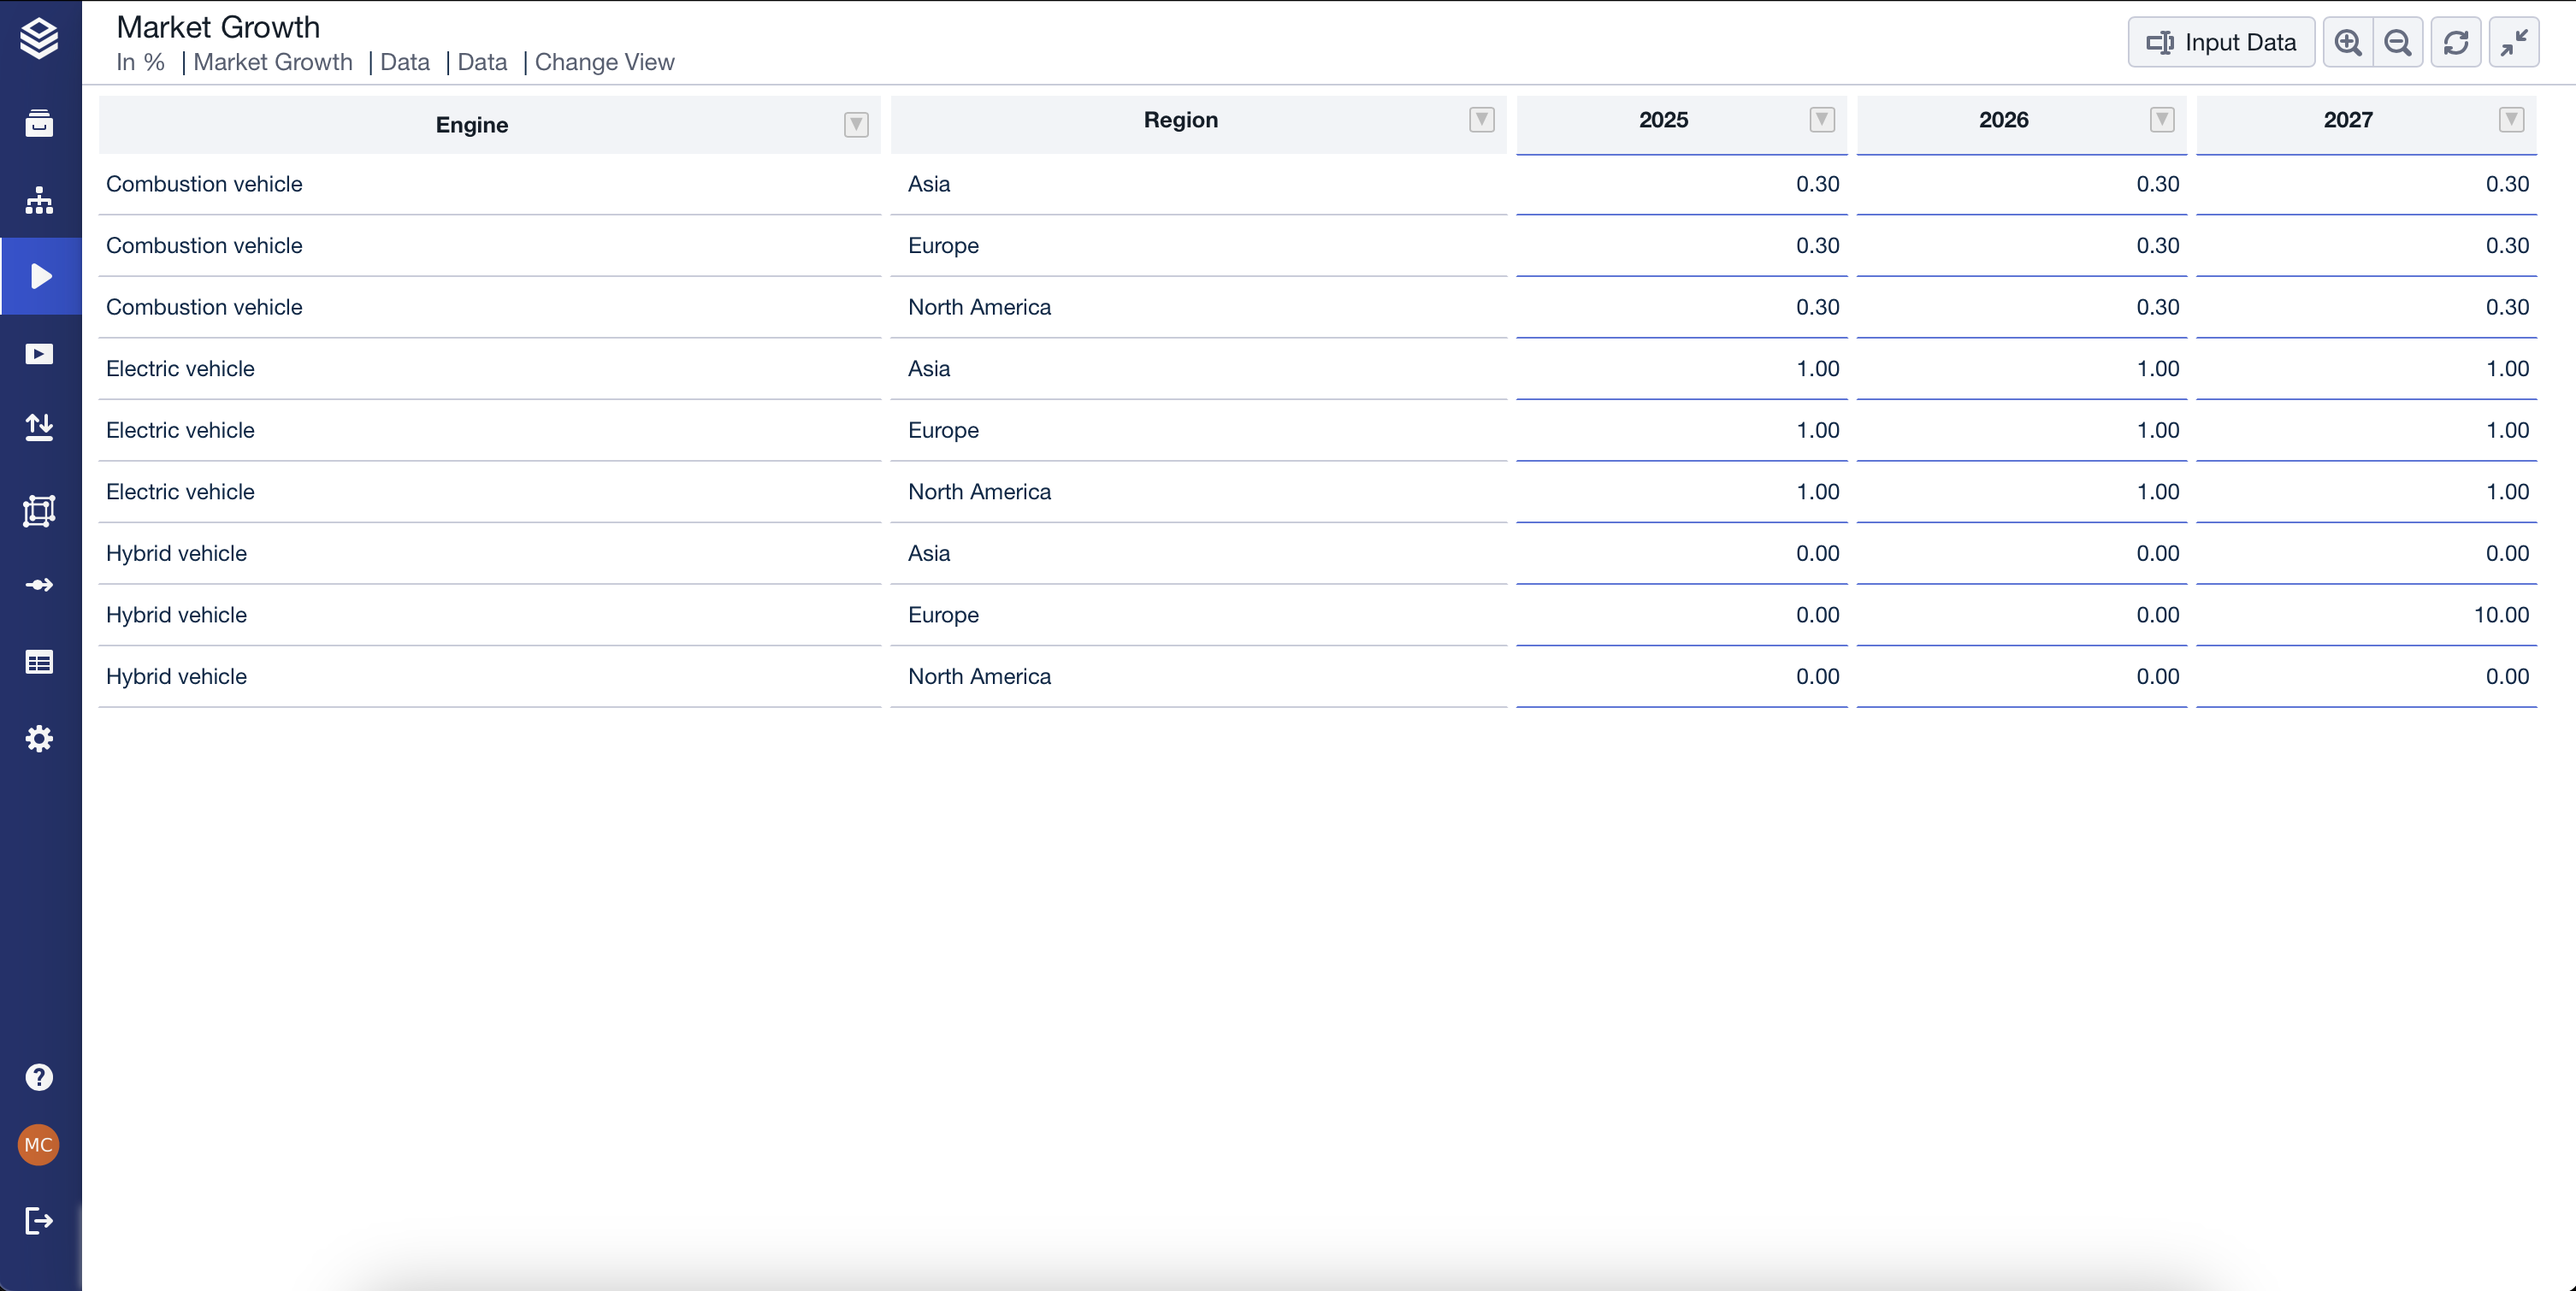
Using a Input Table
Enter Simulation Mode
Hover over the Input Table tile.
Click "Input Data" in the top-right corner.

Modify Data & Simulate
Directly enter values to test different assumptions.
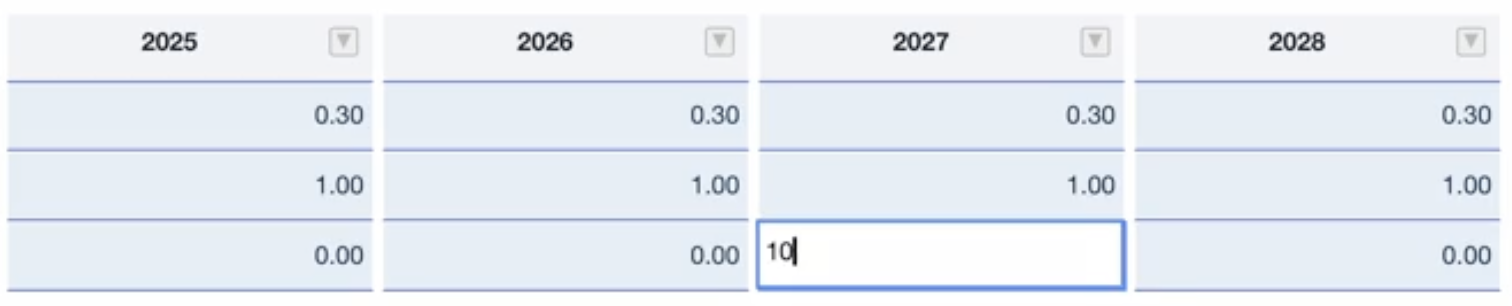
Change View → Enter relative changes.
Result View → Enter absolute values.
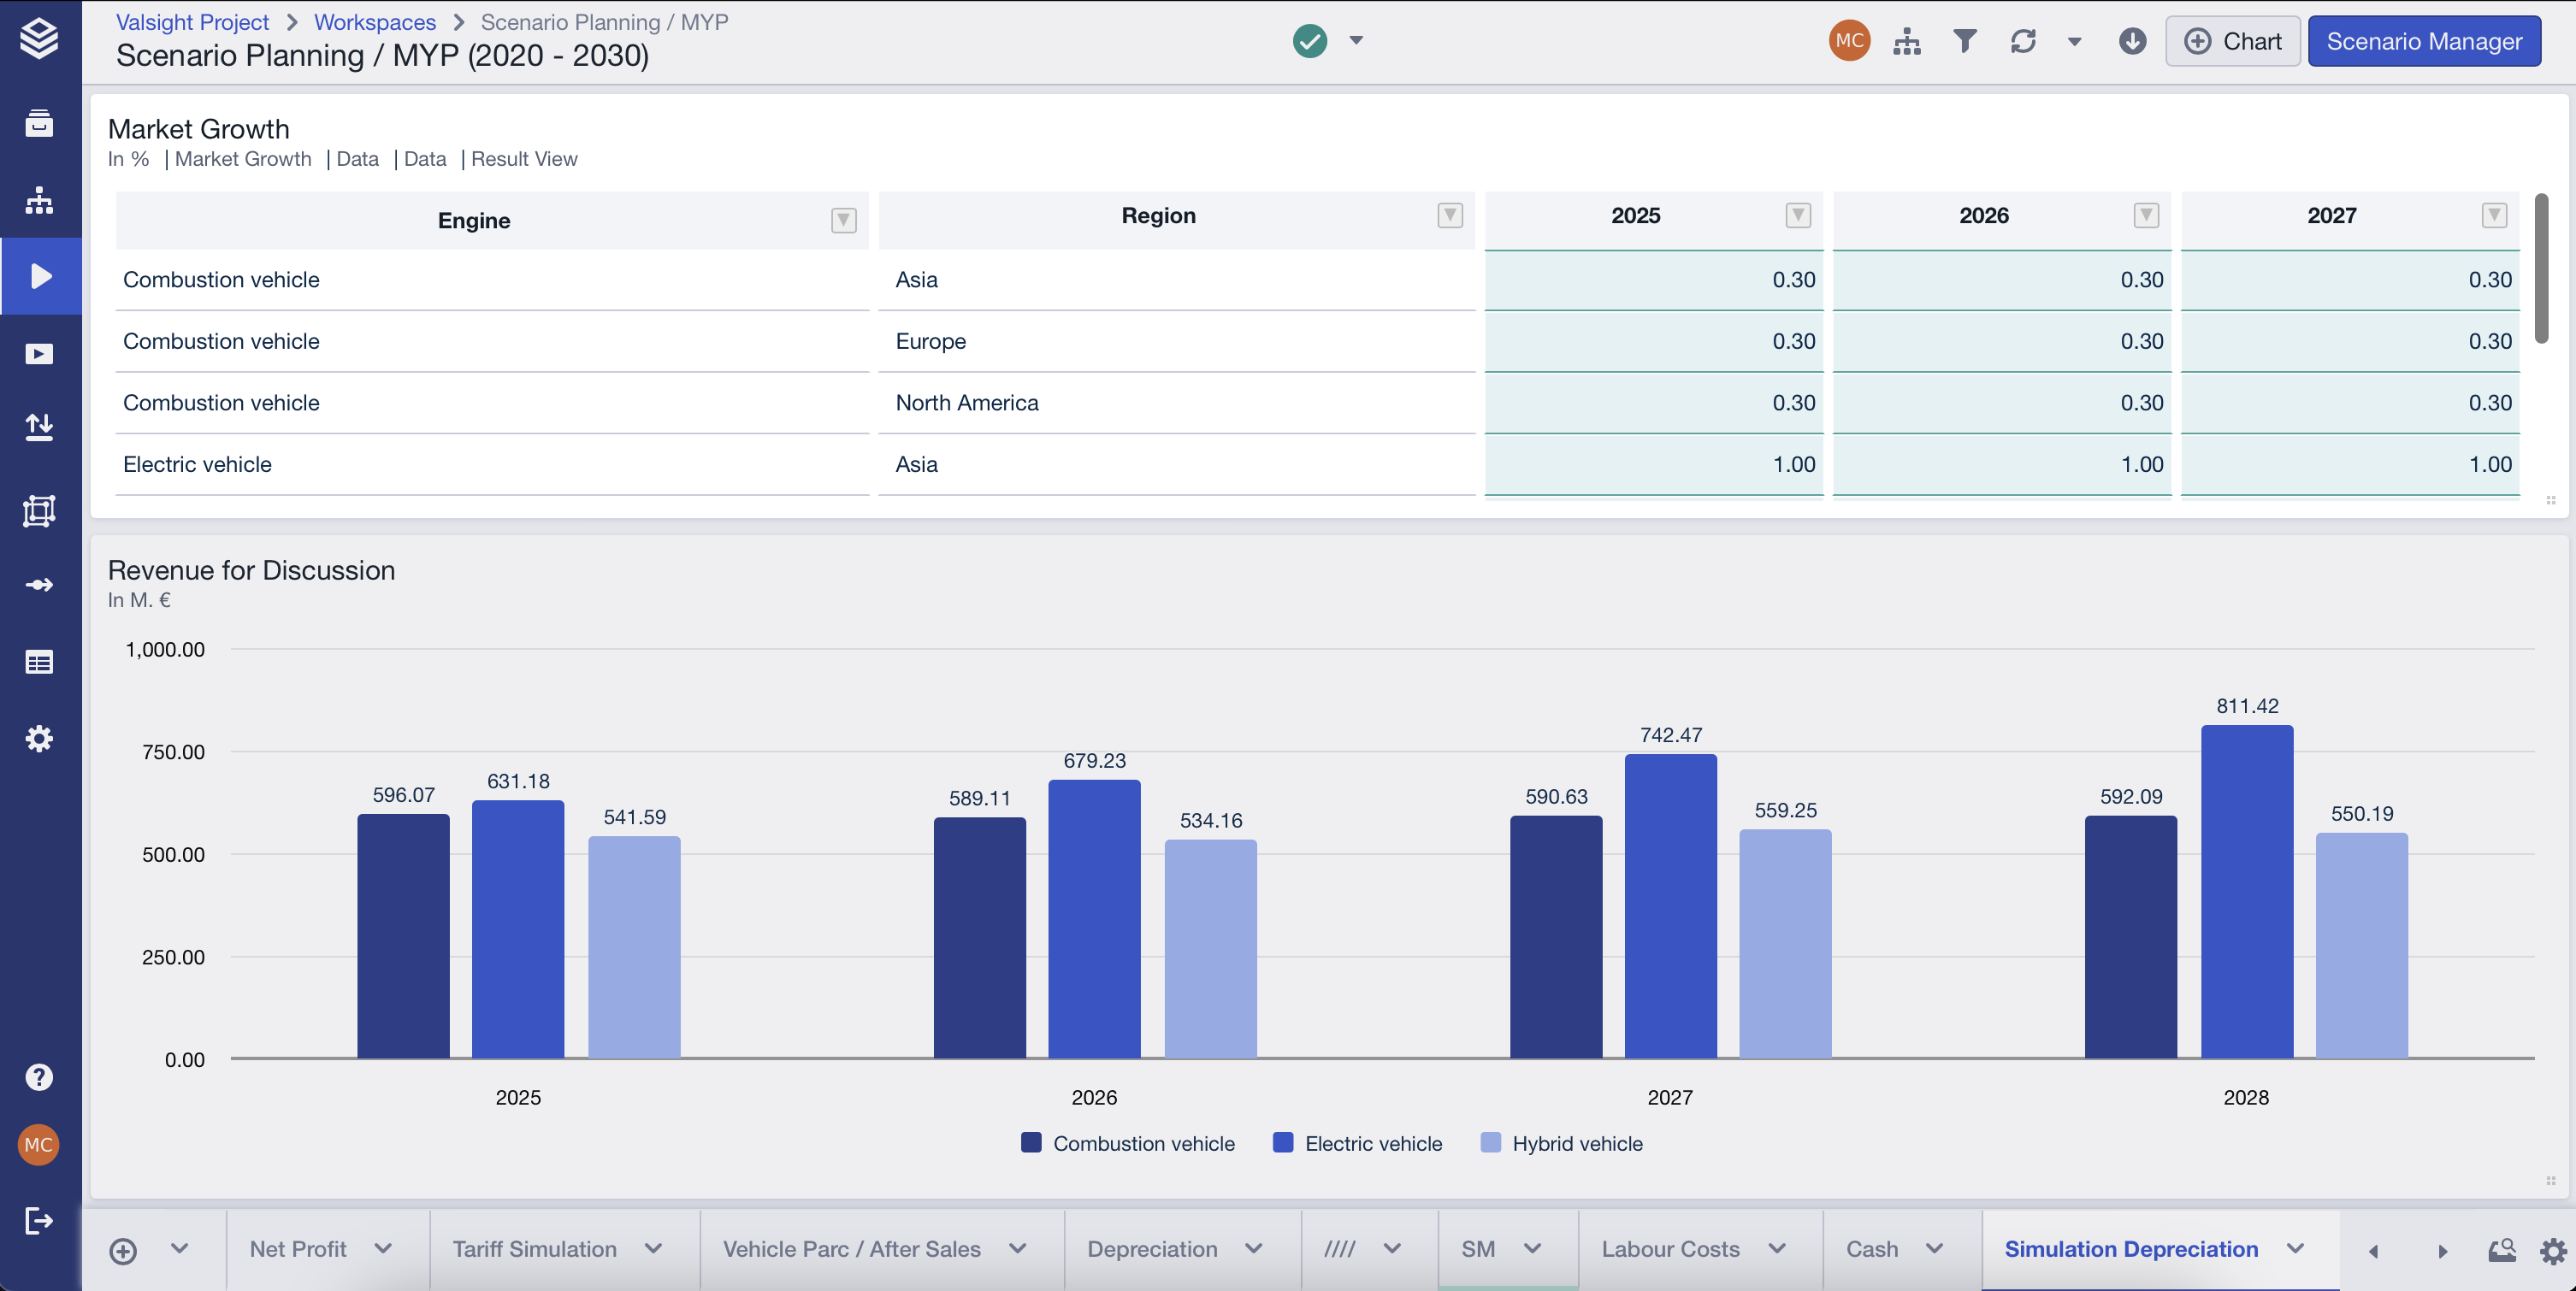
Save Changes
Click "Save" to apply changes across your scenario.
All linked Tables will update automatically to reflect the new simulation.

Additional Features
Maximize & Minimize Tables → Expand the Table for better focus while entering data, without losing your work.
Perspective & Sheet Filters → Automatically adjust the data displayed in the Table.
Seamless Integration → Works directly in the Workspace, avoiding unnecessary navigation.