
Intermediate Sums in Bridges
You can display intermediate sums (grey bars) in a bridge by adding them to the chart.
For example, to show the years 2020, 2021, 2022, and 2023 in this chart,...
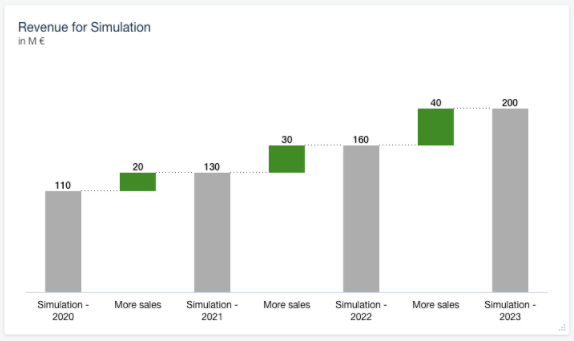
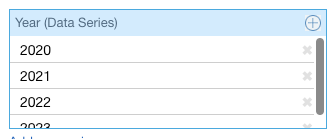
... you have to add them as years in the sidebar.
You can display intermediate sums (grey bars) in a bridge by adding them to the chart.
For example, to show the years 2020, 2021, 2022, and 2023 in this chart,...
... you have to add them as years in the sidebar.