Line-Item Data & Details
To see the data of a Line-Item, click on the name the Line-Item.
The data view will open on the right side of the screen. In the columns of the data table are the levels of your Line-Item, the ‘Base’ that comes from the model, the ‘Change’ column, the ‘Result’ column, and a column where you can enter a comment or description for each row.
Setting filters for the columns on that screen can be used to temporarily focus the view onto the data. After the next browser refresh or after leaving the data view, these filters have been resetted.
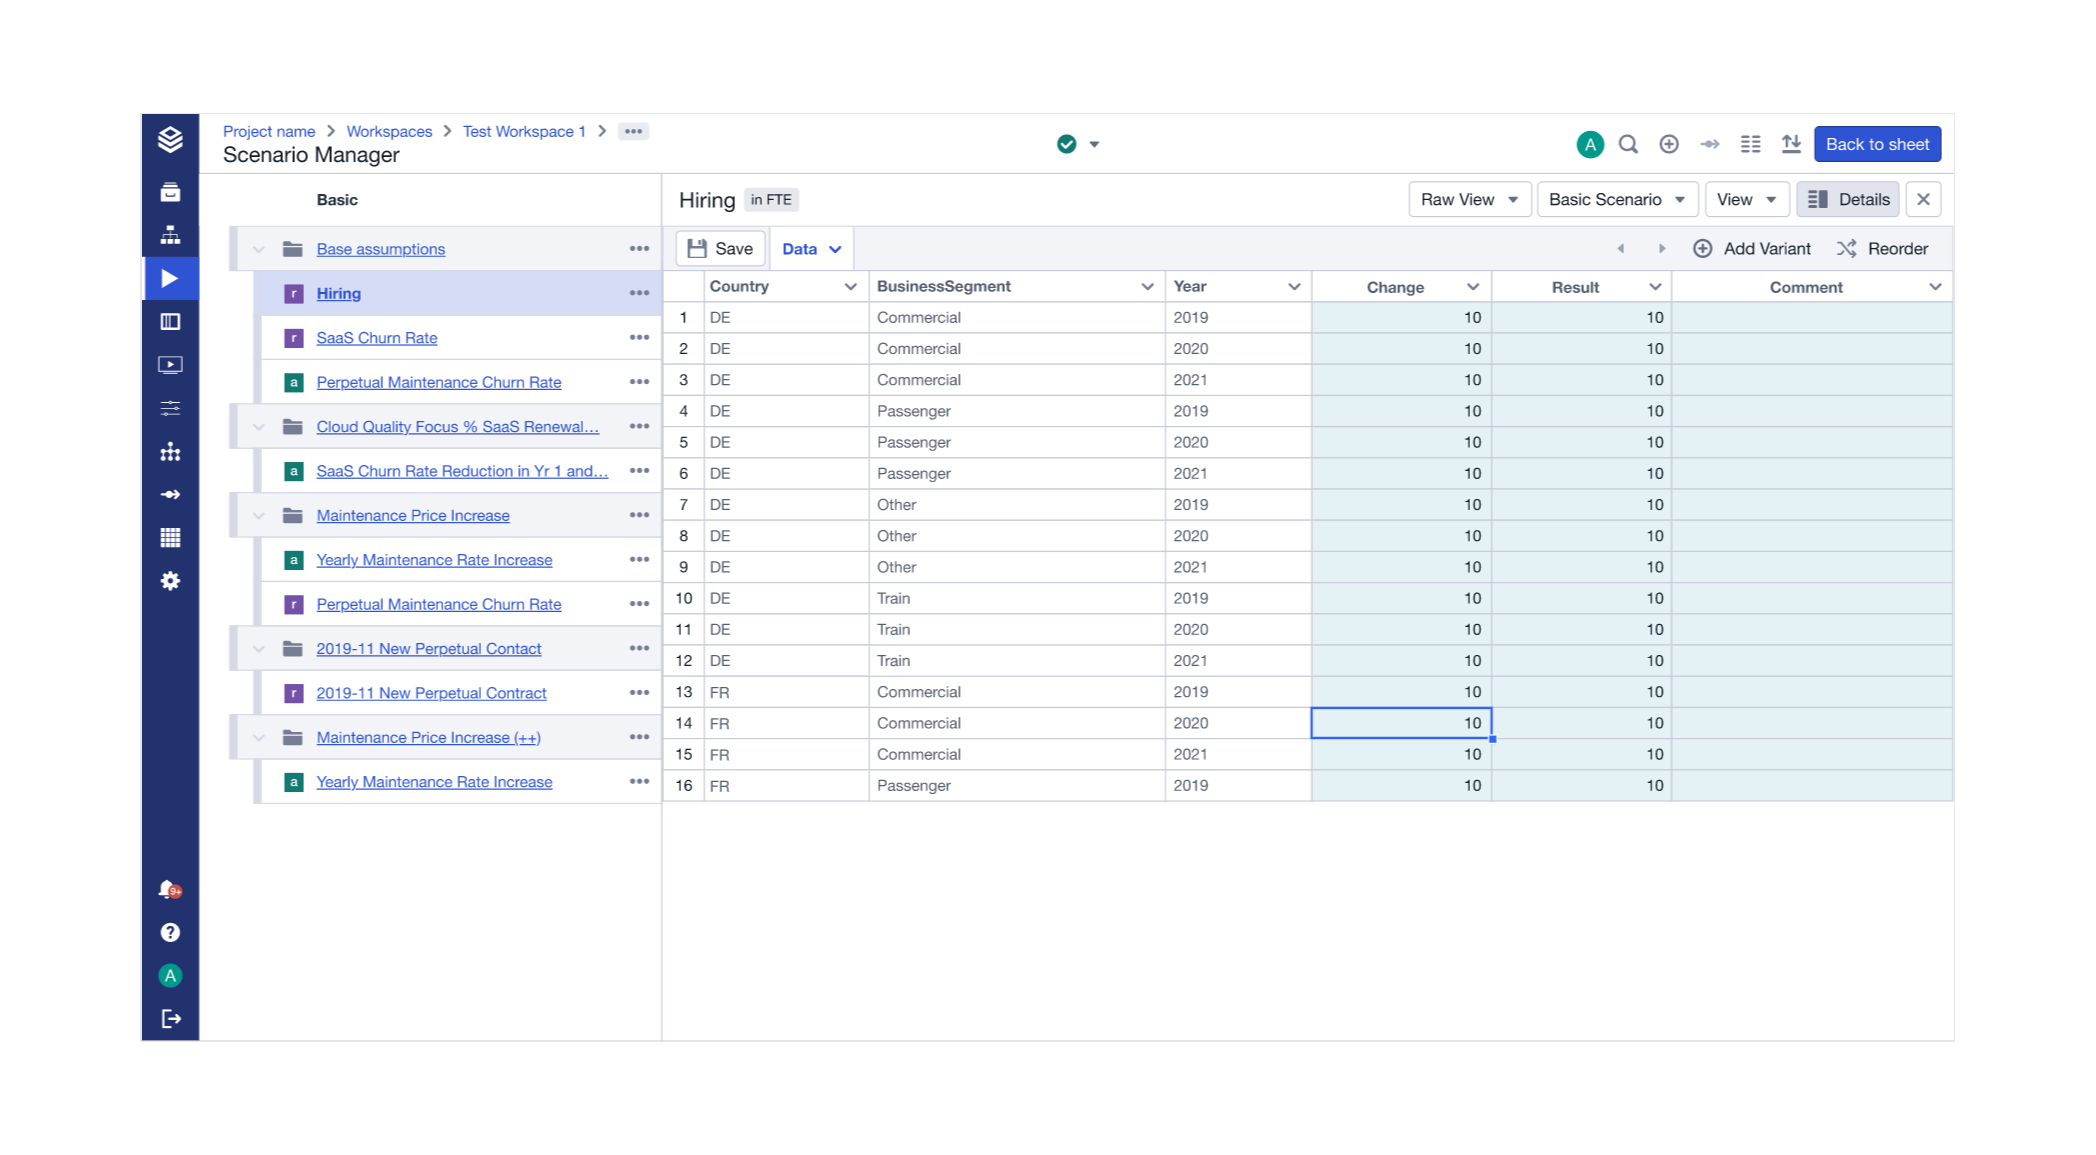
To see the details of your Line-Item, click on the “Details” button in the upper right corner. On that screen, you can see more details of your Line-Item.
Supported Number Formats in Line-Item Tables
Valsight Line-Item tables support numeric values only, with flexible formatting options to streamline data entry. Below is a guide to the supported formats and behaviors:
Supported Formats
Numbers: Standard numeric values such as
1,1.21, or1,21are supported.Decimal Separator: The use of
commaordotfor decimal places depends on your language settings.Percentages: You can paste percentages directly. For example, entering
12will be interpreted as12%.
Flexible Input Handling
Copy & Paste: Values can be copied from sources like Excel, and non-numeric characters (e.g.,
€,$, ora) will automatically be removed. For example:Pasting
12€becomes12.Pasting
12abecomes12.
Units and Symbols: Letters or symbols at the end of a number are removed.
Unsupported Formats
Non-Numeric Strings: Entries like
12ab1orabcare not supported.Multiple Decimals: Values such as
12.1.2are invalid
When pasting multiple values or cells into a Line-Item table, any valid numbers will be processed and inserted, while invalid entries will be ignored. A toast message will appear to inform you of the skipped values, listing all invalid entries for your reference.
Pivoting the Line Item Data Table
Pivoting the Line Item Data Table enhances data visualization and entry by allowing the time dimension to be displayed in columns rather than in rows. This is particularly beneficial for faster adjusting data or copying and pasting data from spreadsheets. To access this feature, select “Change View” or “Results View” from the “All Details” dropdown within a line item view.
"Change View" simplifies entering expected changes (e.g., a 2% sales volume increase in 2025).
"Results View" allows inputting desired outcomes (e.g., desired result of 4% increase in sales volume in 2025).
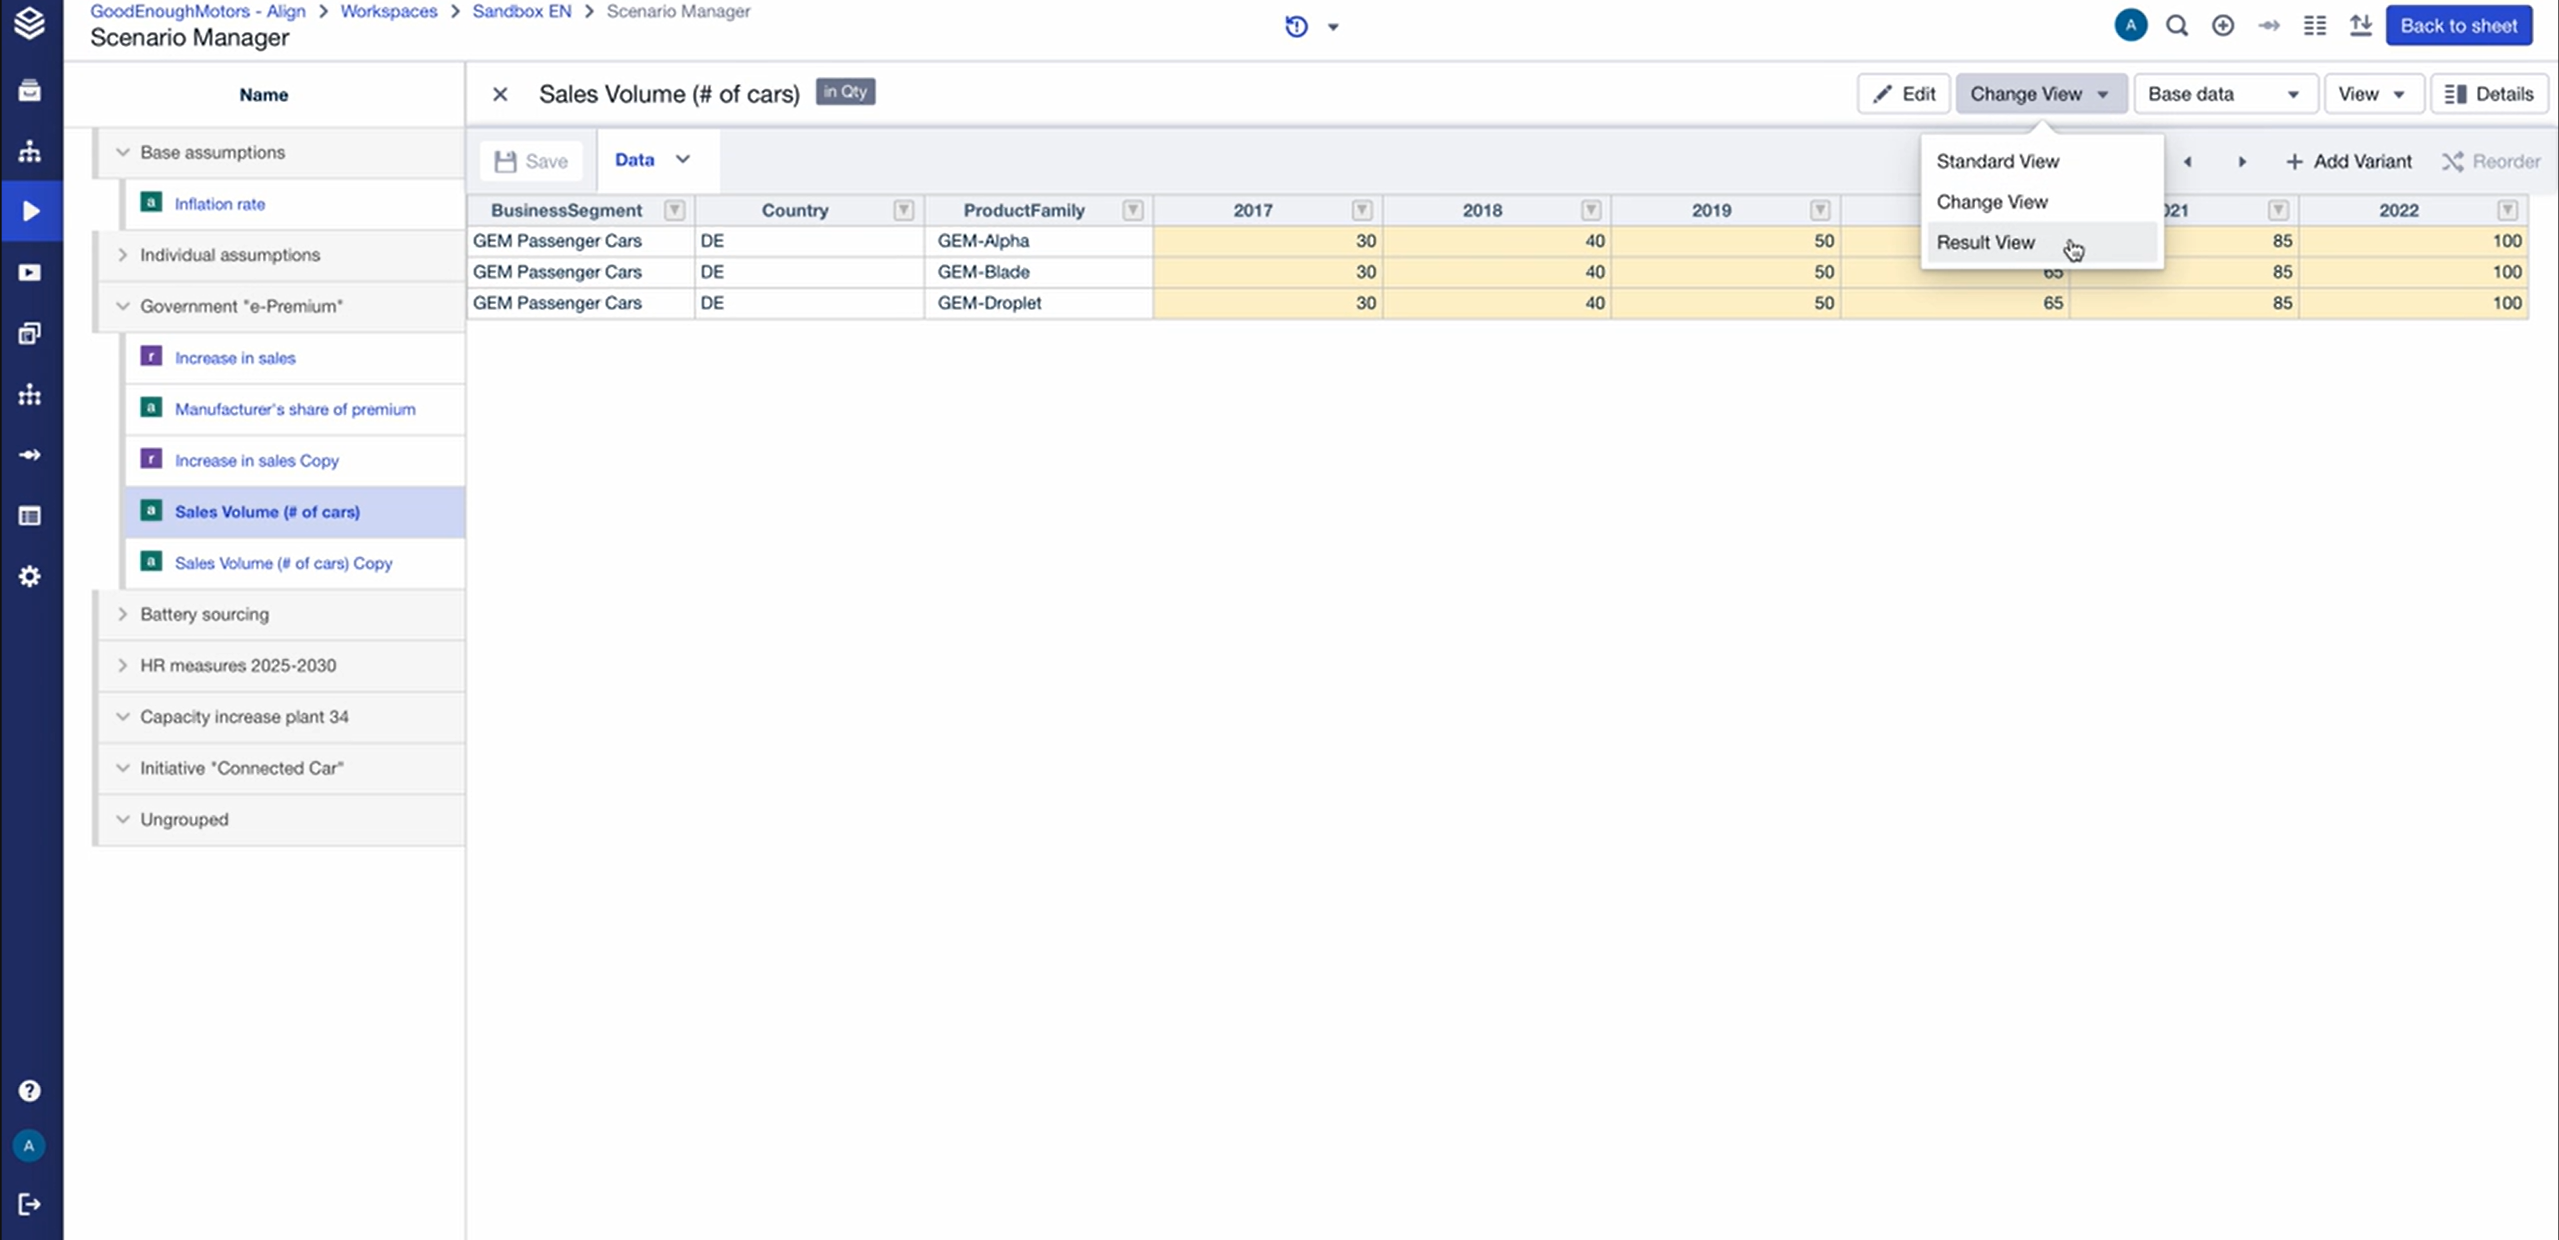
Adjusting data in one view dynamically updates the other, enabling comprehensive analysis and easier data management.
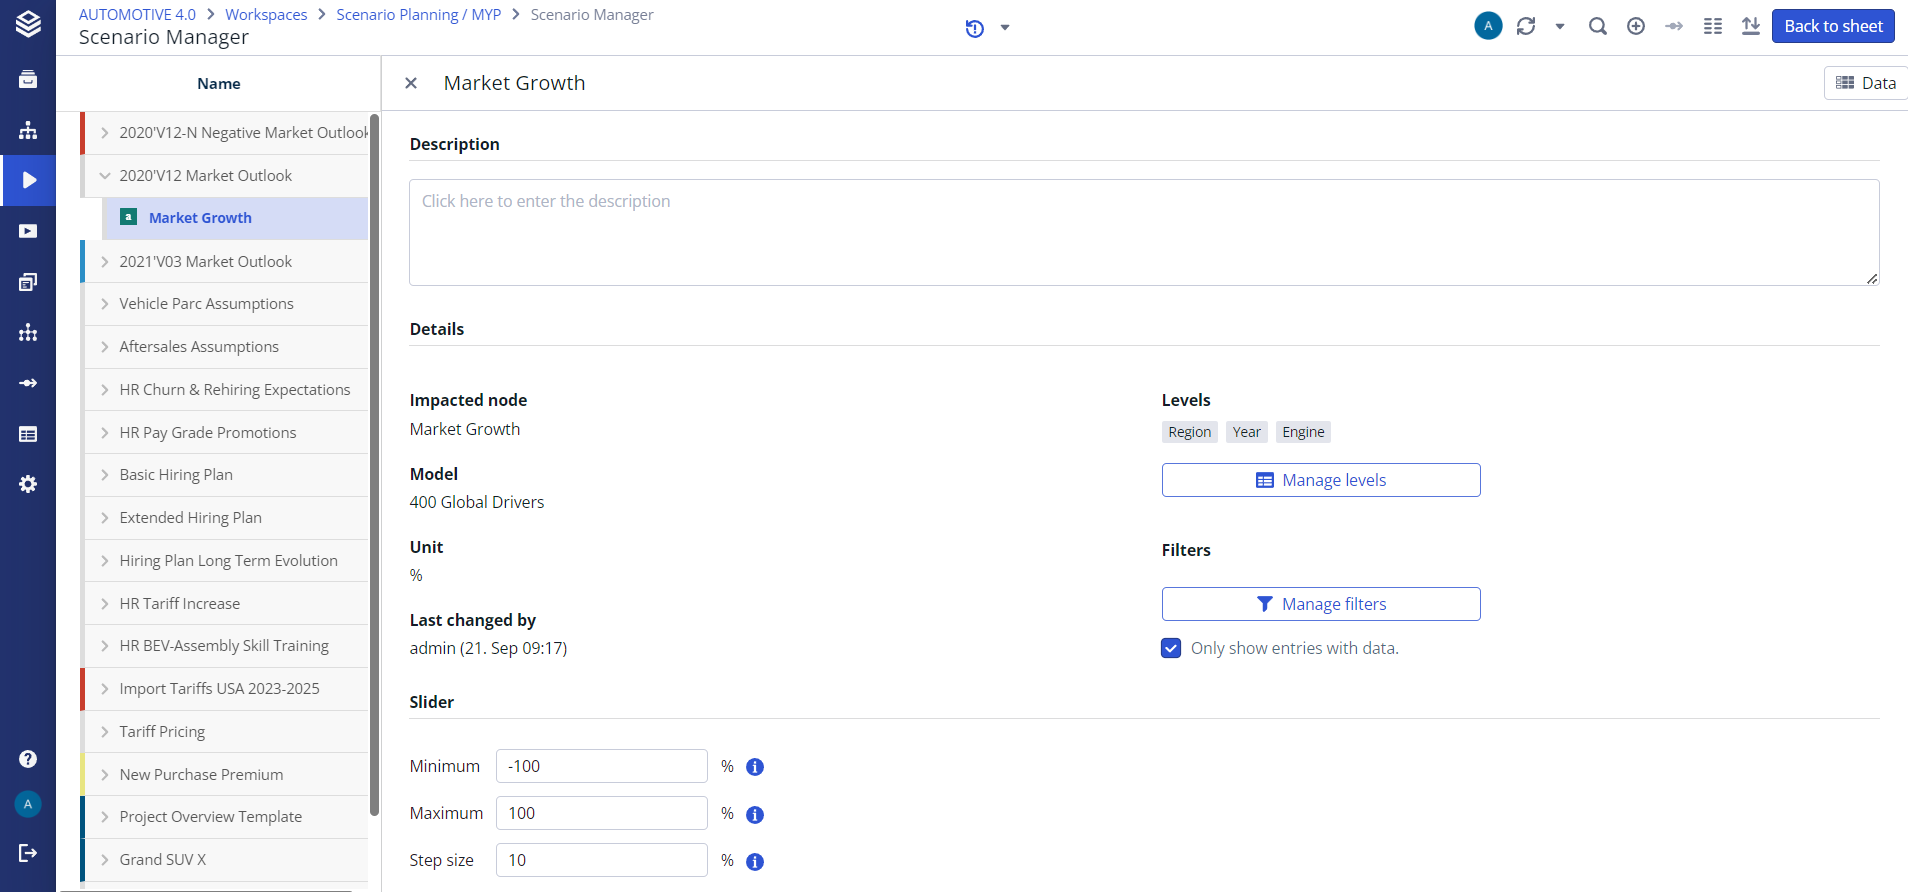
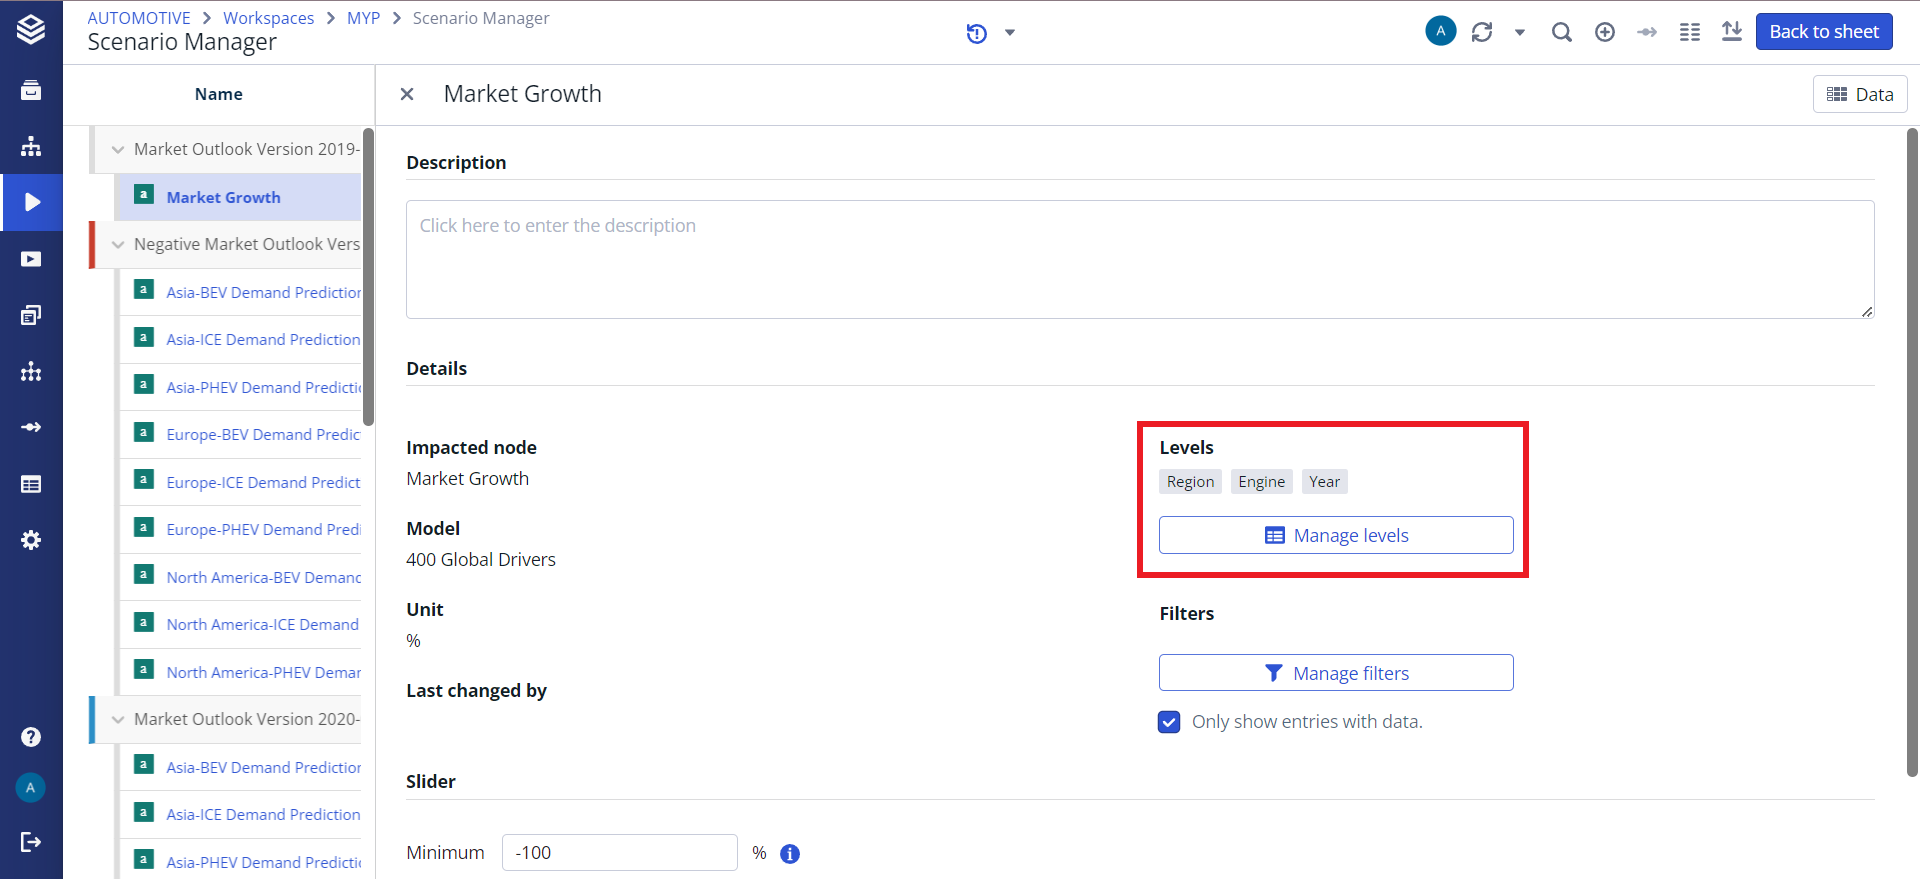
Manage Levels
To change the dimensionality of your relative Line-Item, use the “Manage levels” button in the details view.
This dialog shows the levels of the dimensionality of your Line-Item. For relative Line-Items it is possible to delete or add levels.
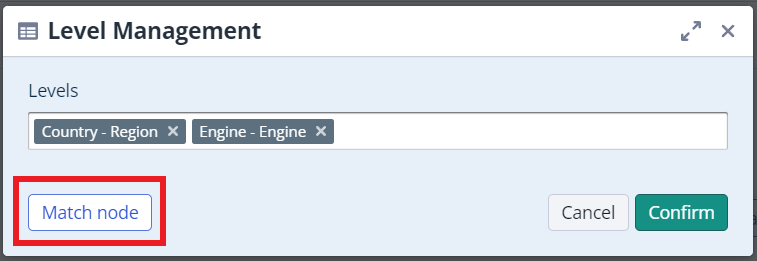
Match Node
In case your Line-Item does not match the dimensionality of the underlying node, a warning in the data view and an extra button will be displayed.
Using this button (“Match Node”) will automatically bring the Line-Item onto the dimensionality of your node and the warning will no longer be shown.