
Sliders in the Scenario Manager
Sliders in the Scenario Manager allow you to modify existing line-items with the ease of a slider without having to enter the line-item data itself.
Preparation
Add a resizable Scenario Manager to a sheet with the charts you want to see get updated. Click on the dropdown next to the 'Chart' button and choose Scenario Manager. A resizable version of the Scenario Manager will appear.
Show the “Slider” column in the Scenario Manager. The Slider will appear.
Which Line-Items do you want to display Sliders for? Sliders are only displayed for line-items with only one row. Filter your line-items via ‘Details’ > ‘Manage filters and levels’ to one row. The slider should now appear.
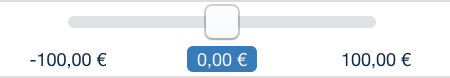
Set the minimum, maximum, and the step size in the 'Details' of the line-item. E.g. a minimum of -100, a maximum of 100, and a step size of 25 will produce a slider like below. You will only be able to choose the values -100, -75, -50, -25, 0, 25, 50, 75, 100.
Line-item variants
Sliders cannot be used for Line-Items that have more than one Variant.
Working with Sliders
Now you can change the slider and see the effects in your charts. Changing the slider will change the data in the line-tiem so all your changes are saved like before.
How to use the Slider for Line-Items with multiple rows
If you want to have a slider that distributes a value over multiple years (e.g. total turnover for 2020-2023) or copies a value to multiple years (e.g. inflation % for 2020-2023), then you have to build that logic in the model. Build the Node in such a way that it takes only one value as input and the following node can then distribute or copy it over a dimension.
Resetting Sliders
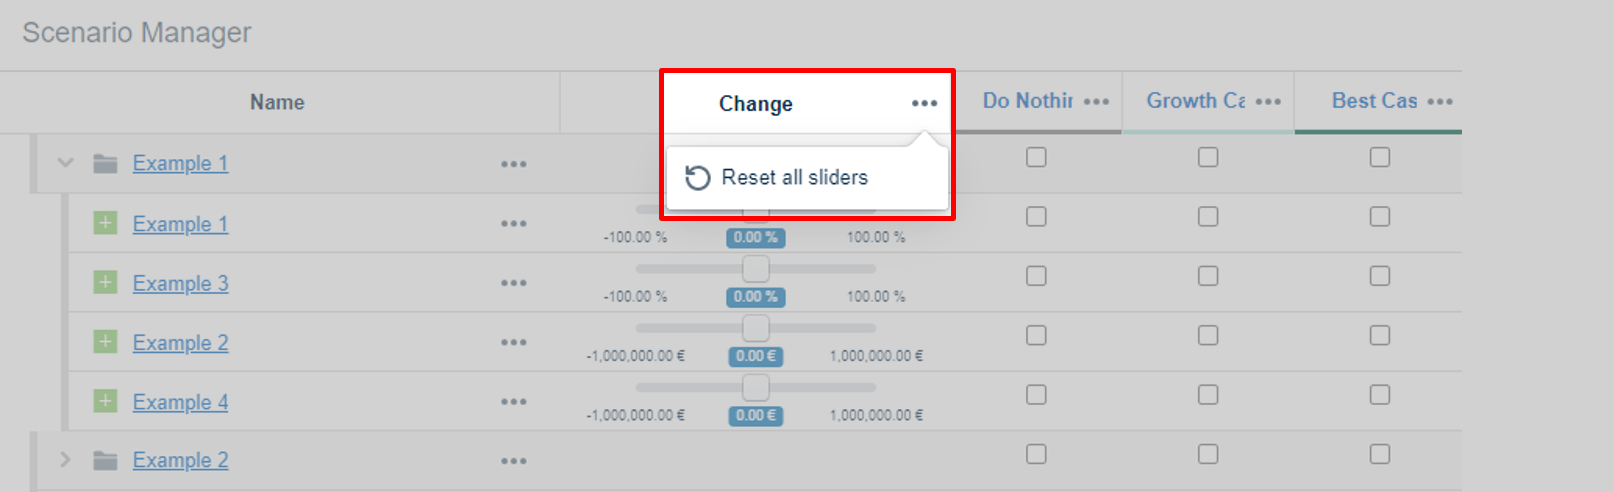
If you want to reset all Sliders, click on the three-dot menu in the change column or the three dot menu on the slider tile itself.
Related documentation
Sliders can also be displayed as a chart directly on the dashboard
Input Tables are another possibility to simulate live on the dashboard