Example Workspace
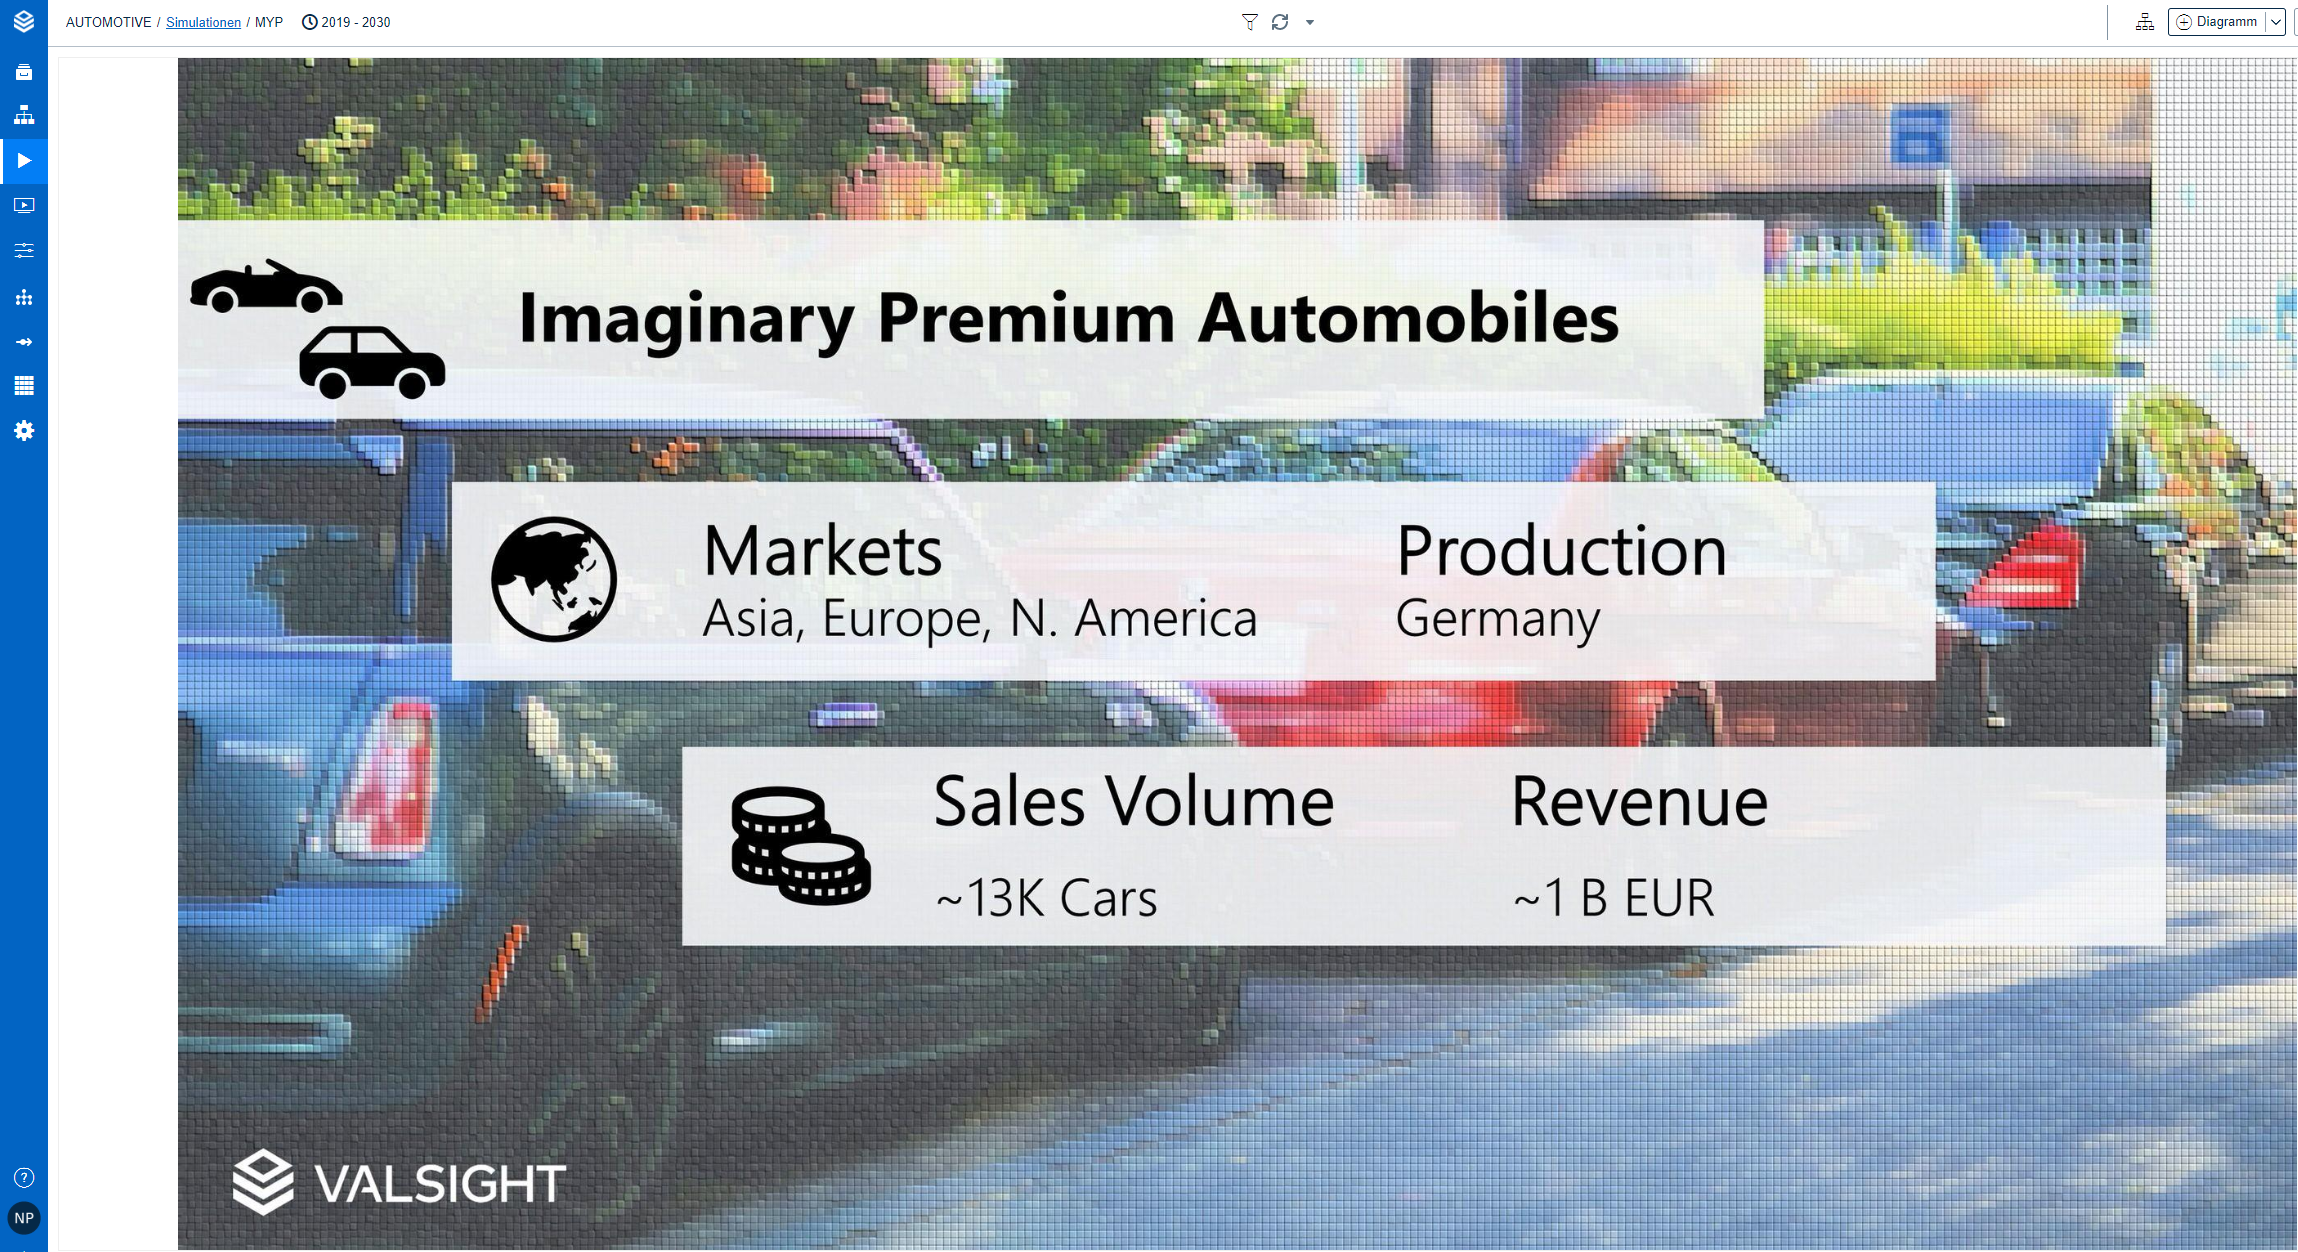
Step - Sheet: Image
The first sheet could contain an emotional image to get the attention of the audience:
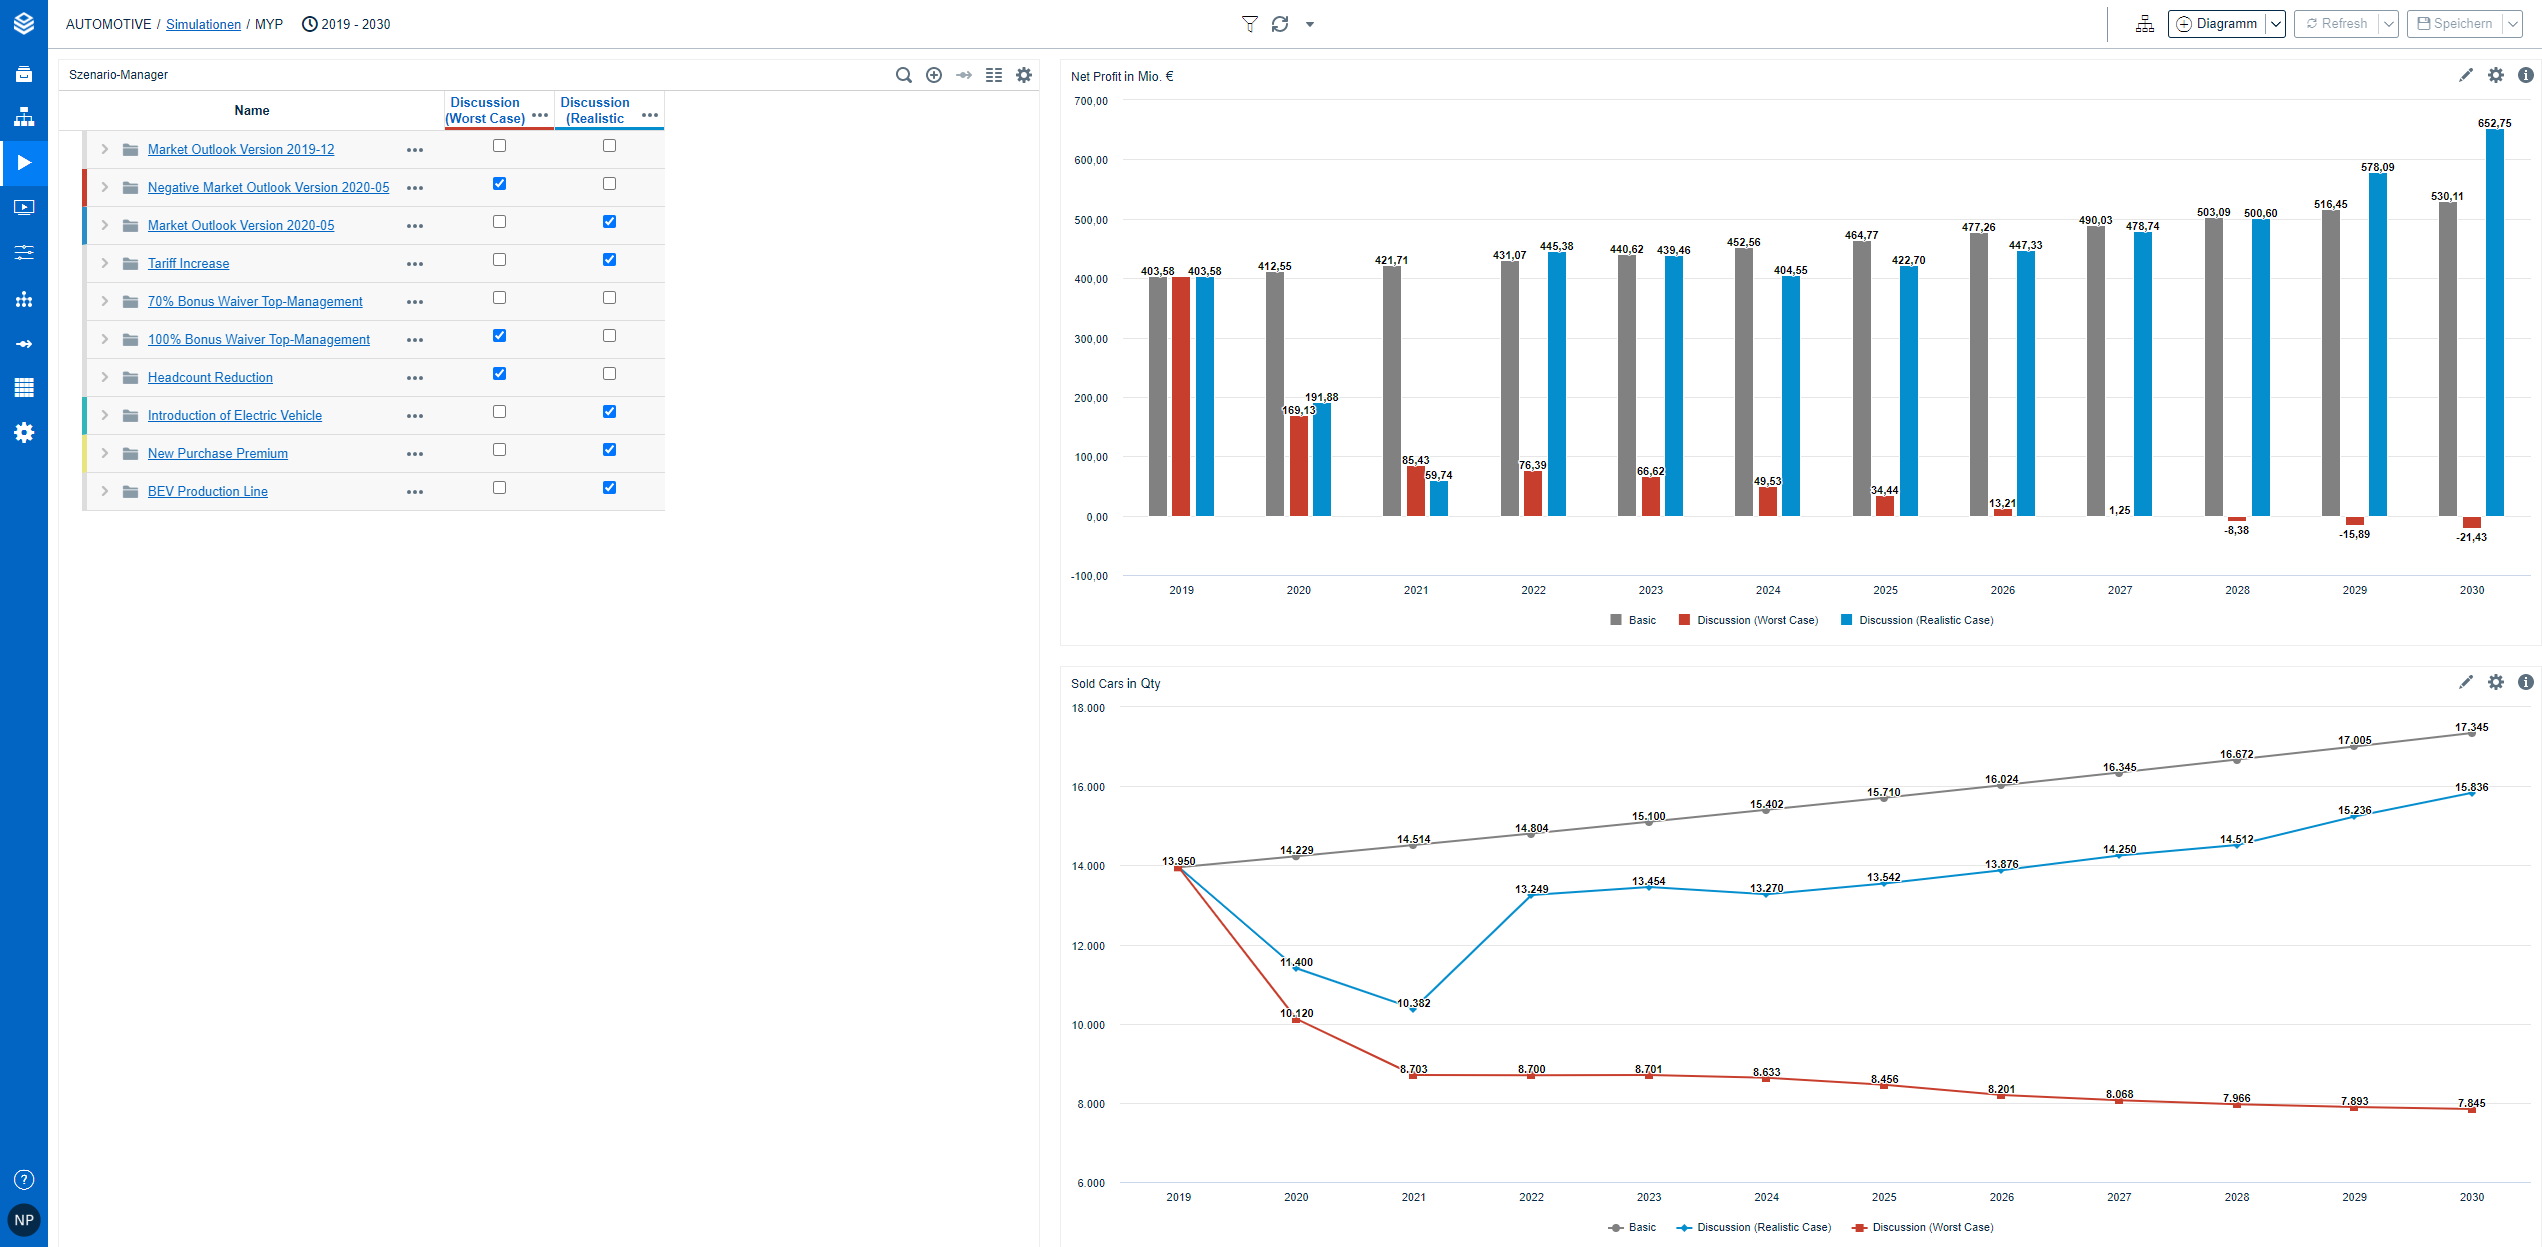
Step - Sheet: Dashboard
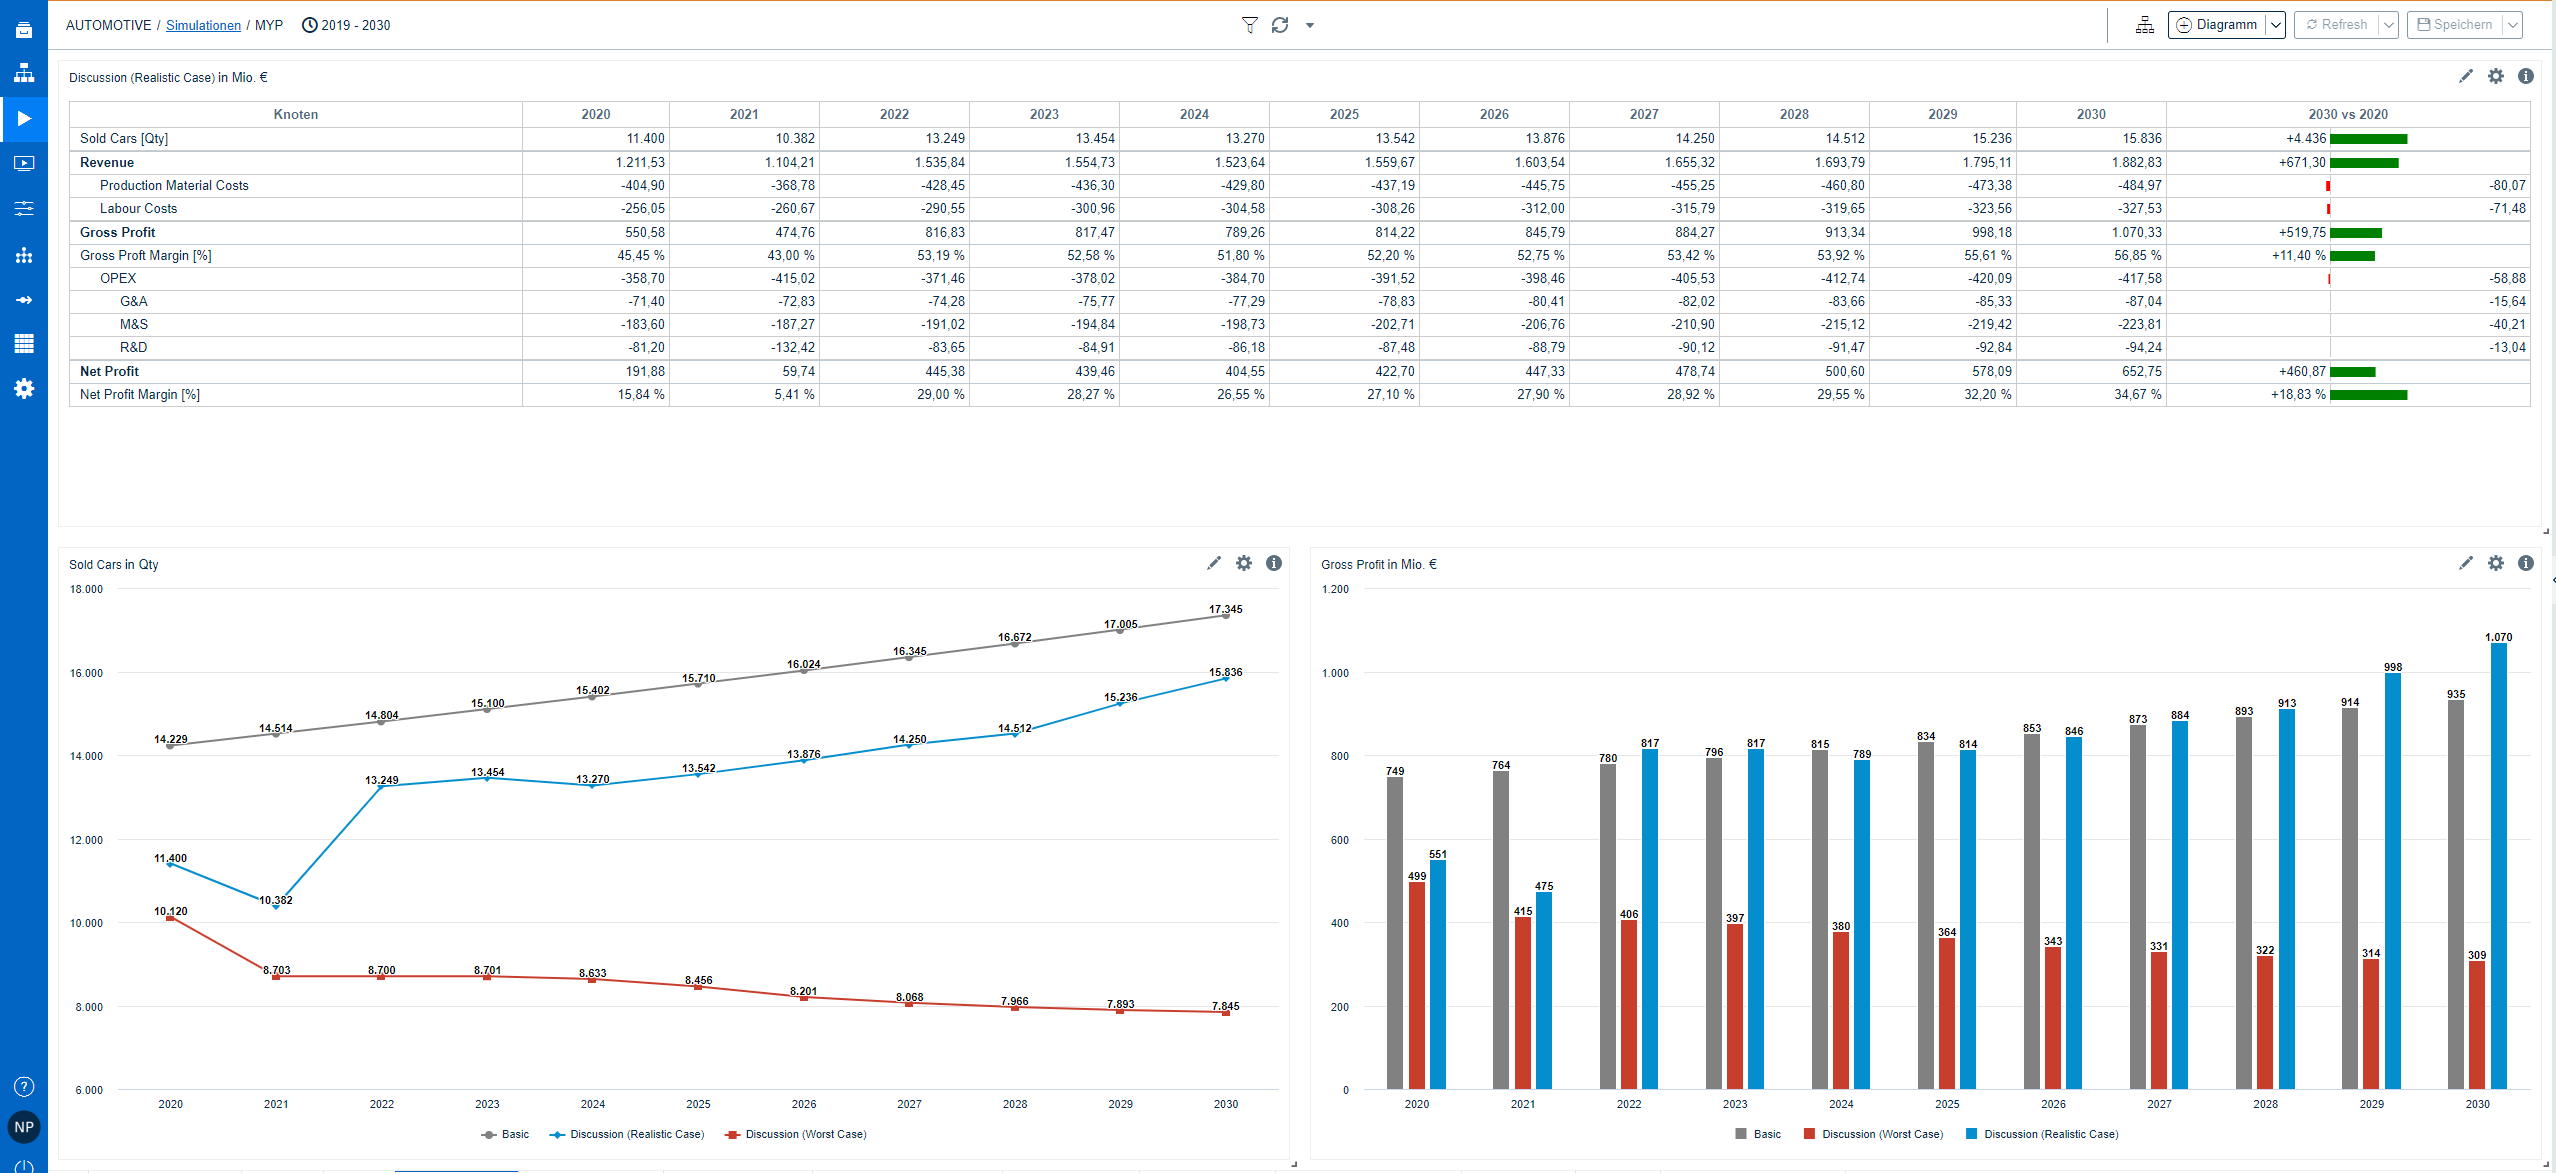
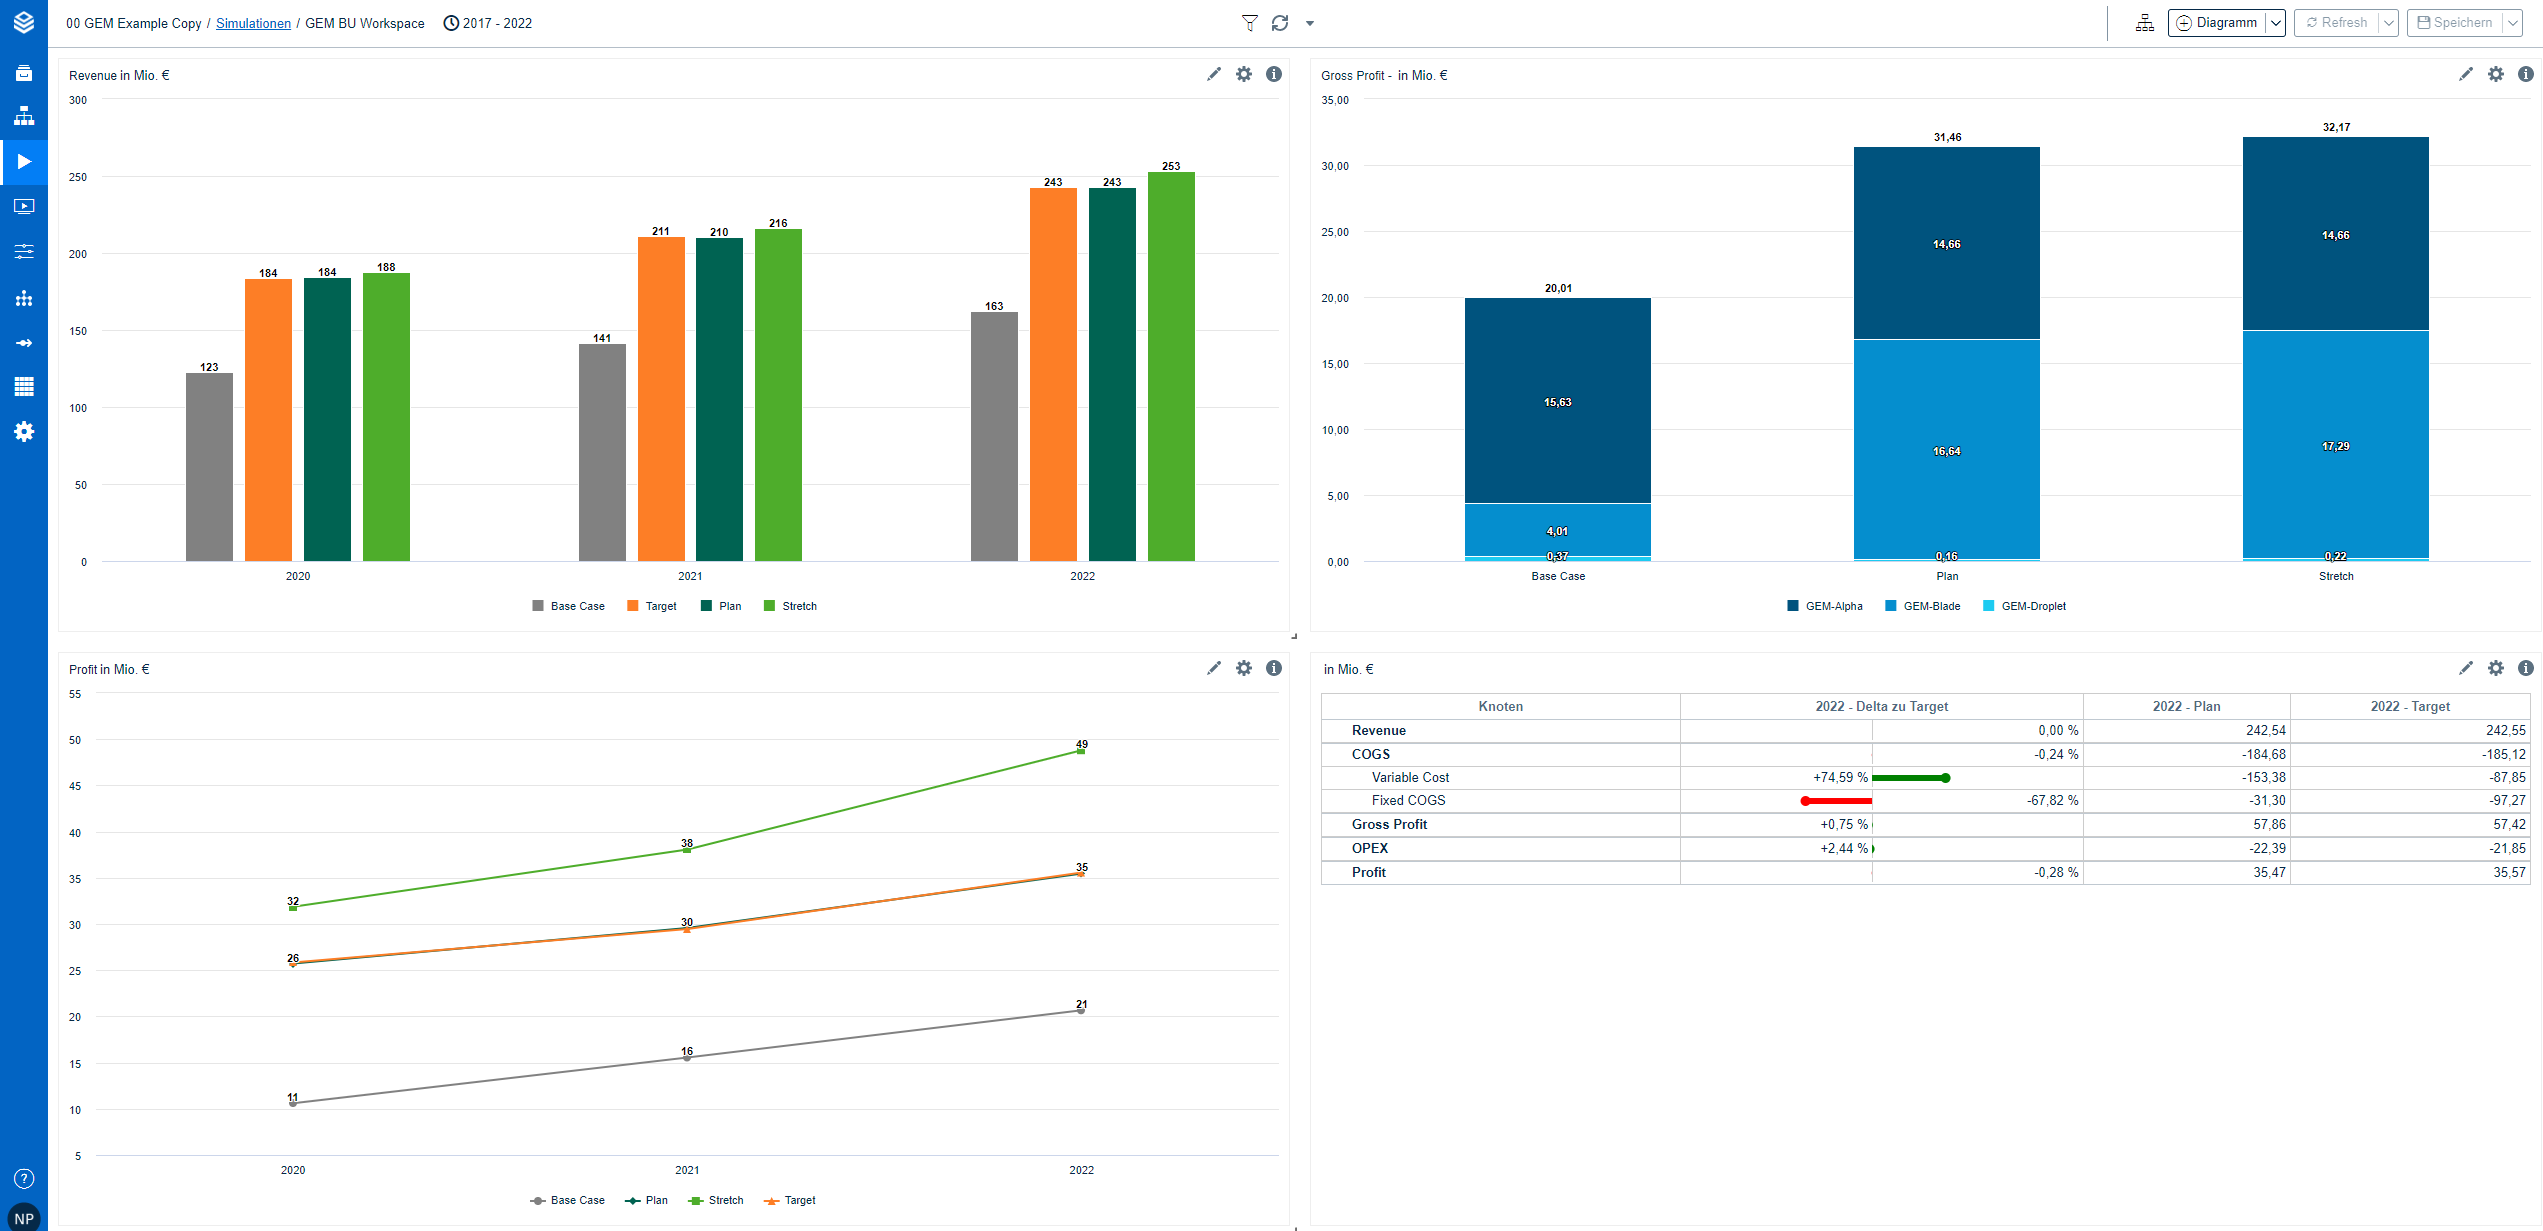
With the help of the dashboard, the audience will get a quick overview of the model. To build up a dashboard, you usually take one P&L grid and 2 or 3 charts of the model:
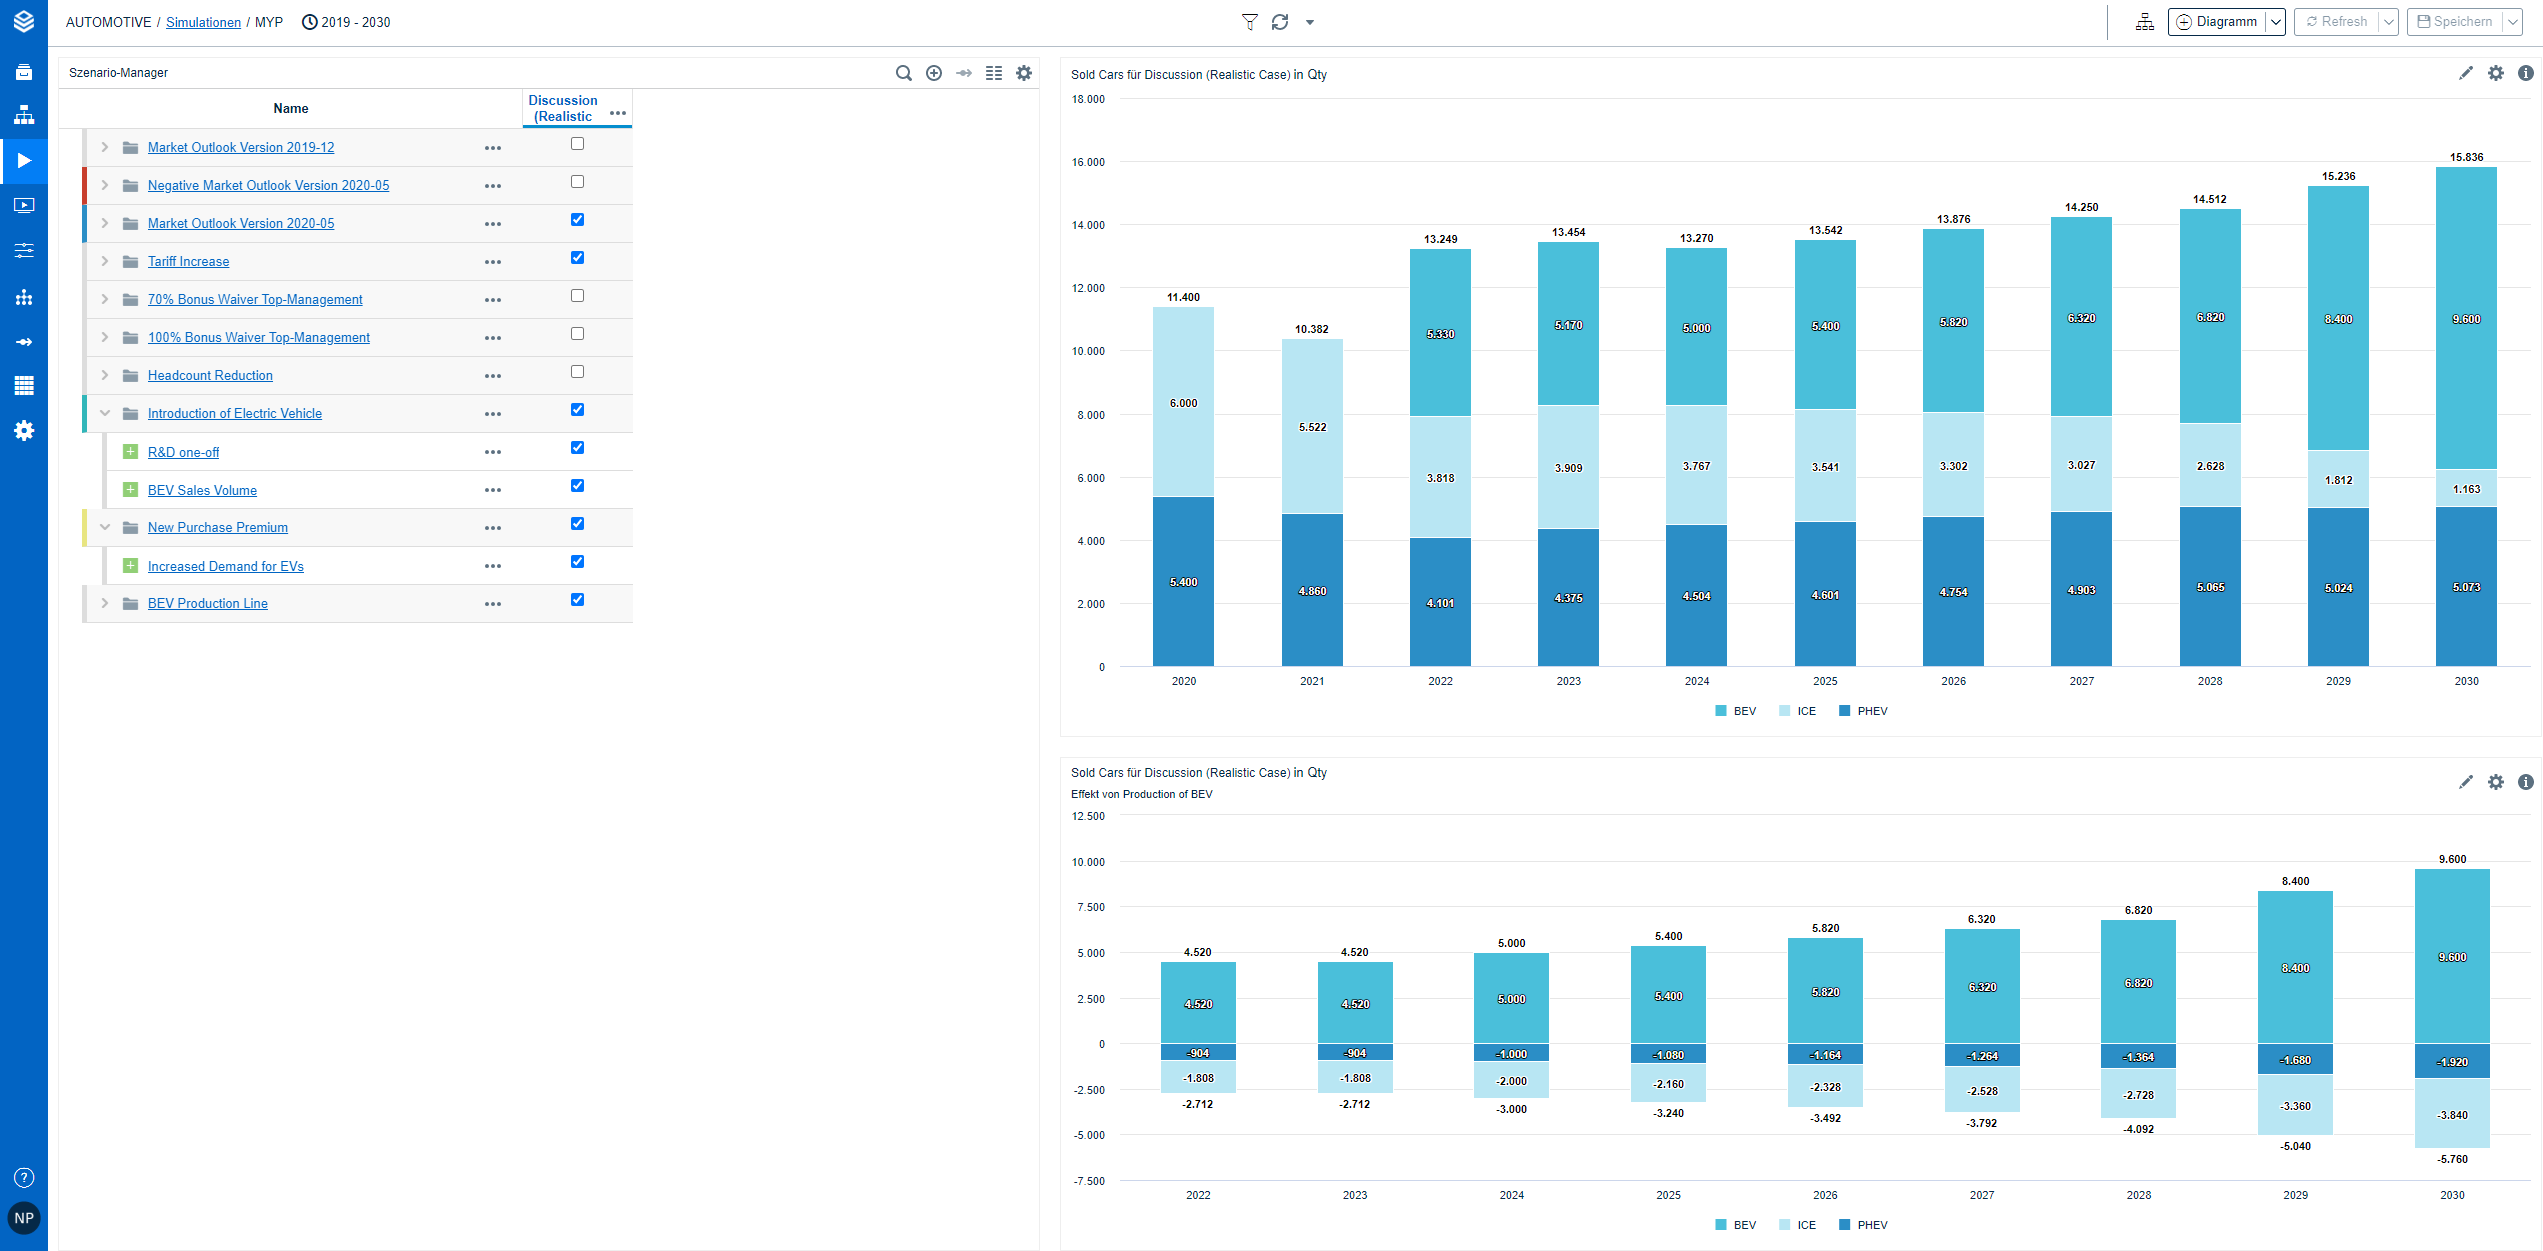
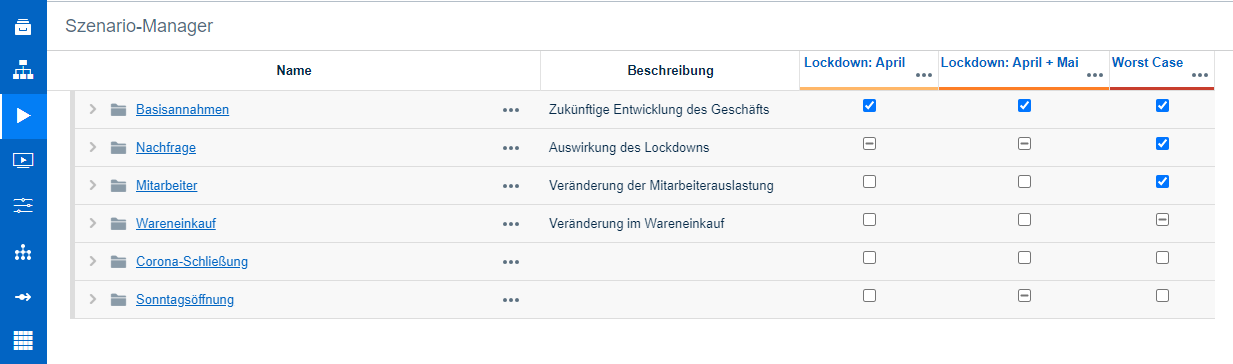
Step - Sheet: Scenario Manager
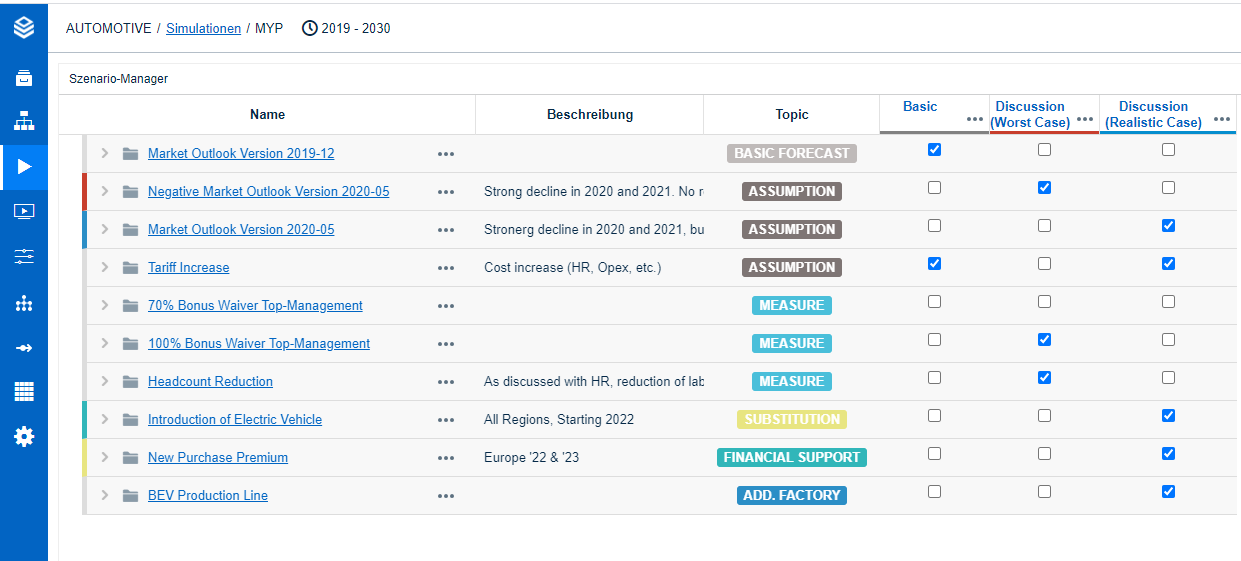
The next step is to describe the Scenario Manager. It is important to explain the assumptions (activated assumptions), scenarios & descriptions:
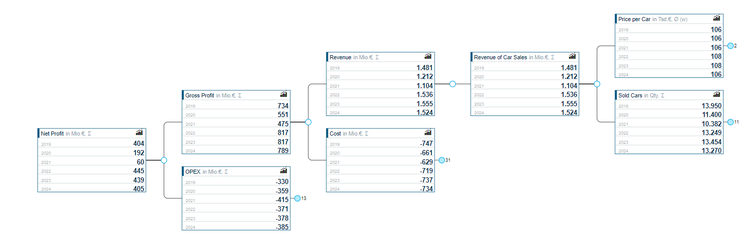
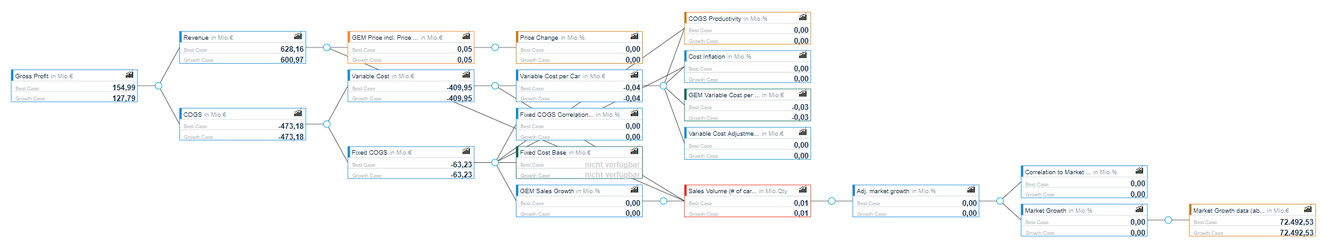
Step - Sheet: Model Tree:
The model tree will be on the next sheet to explain the cause-effect-relationship of the model:
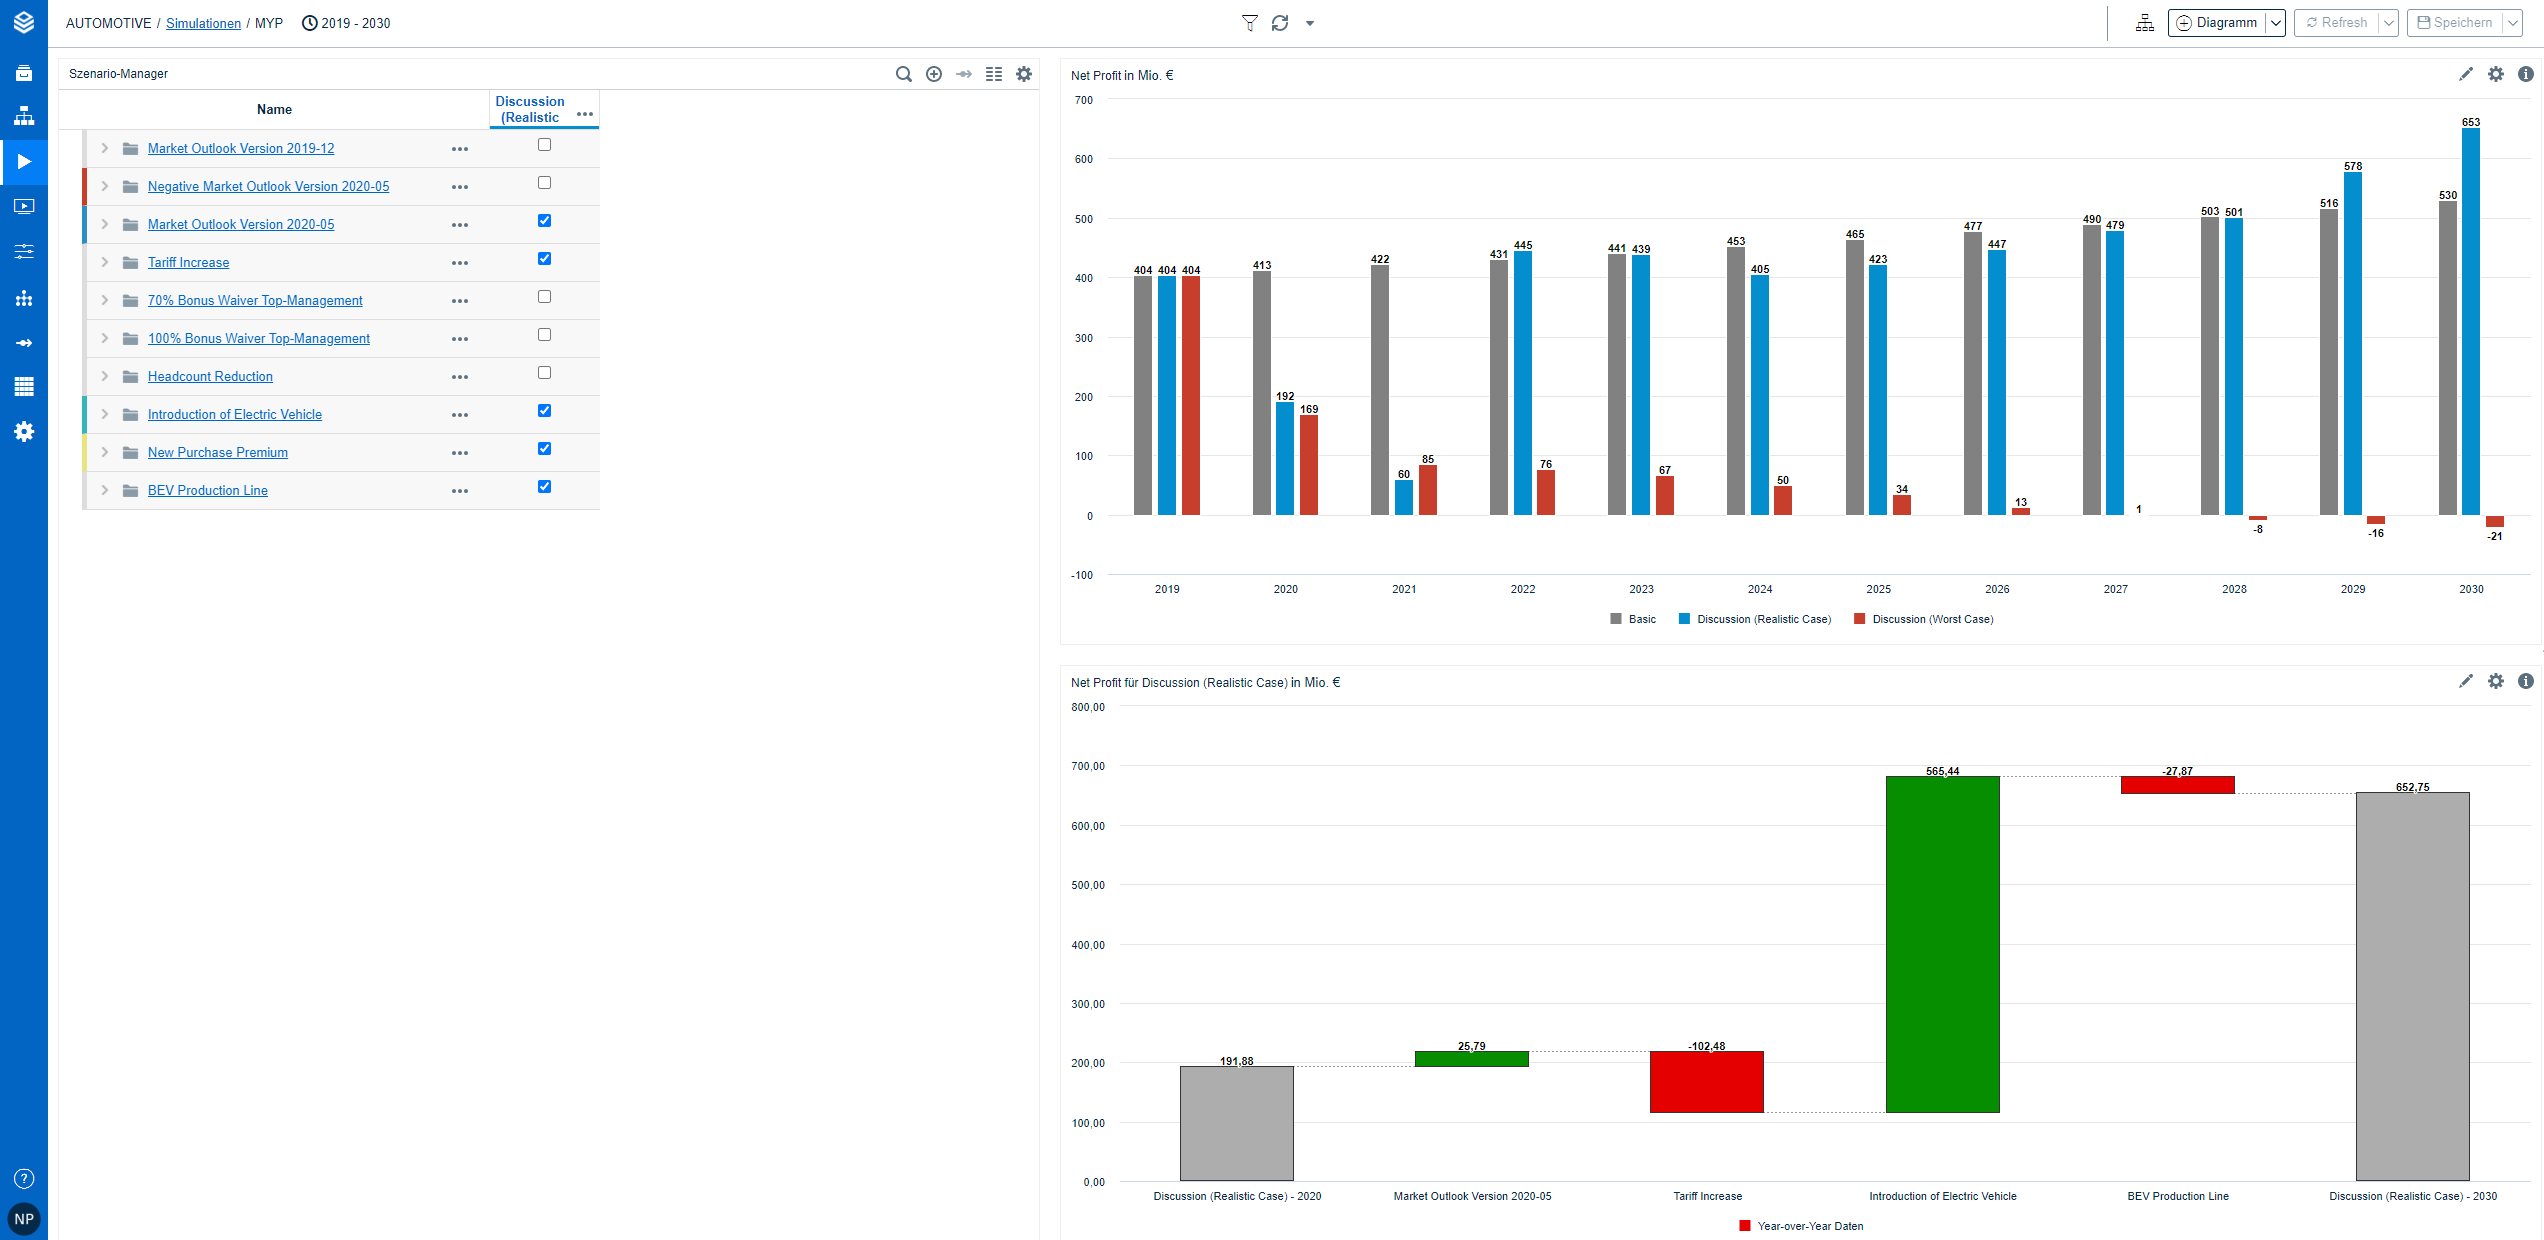
Step - Sheet: Charts and Bridges:
Step 5 is about the story that the model should tell. Here you can add 4 to 5 sheets with 3 to 4 different charts (including Bridges; Usually with minimized Scenario Manager on each sheet → Activation for Story):