Time Bridges
In this article, you will find a tutorial on how to create Time Bridges, as well as an explanation of their calculation logic.
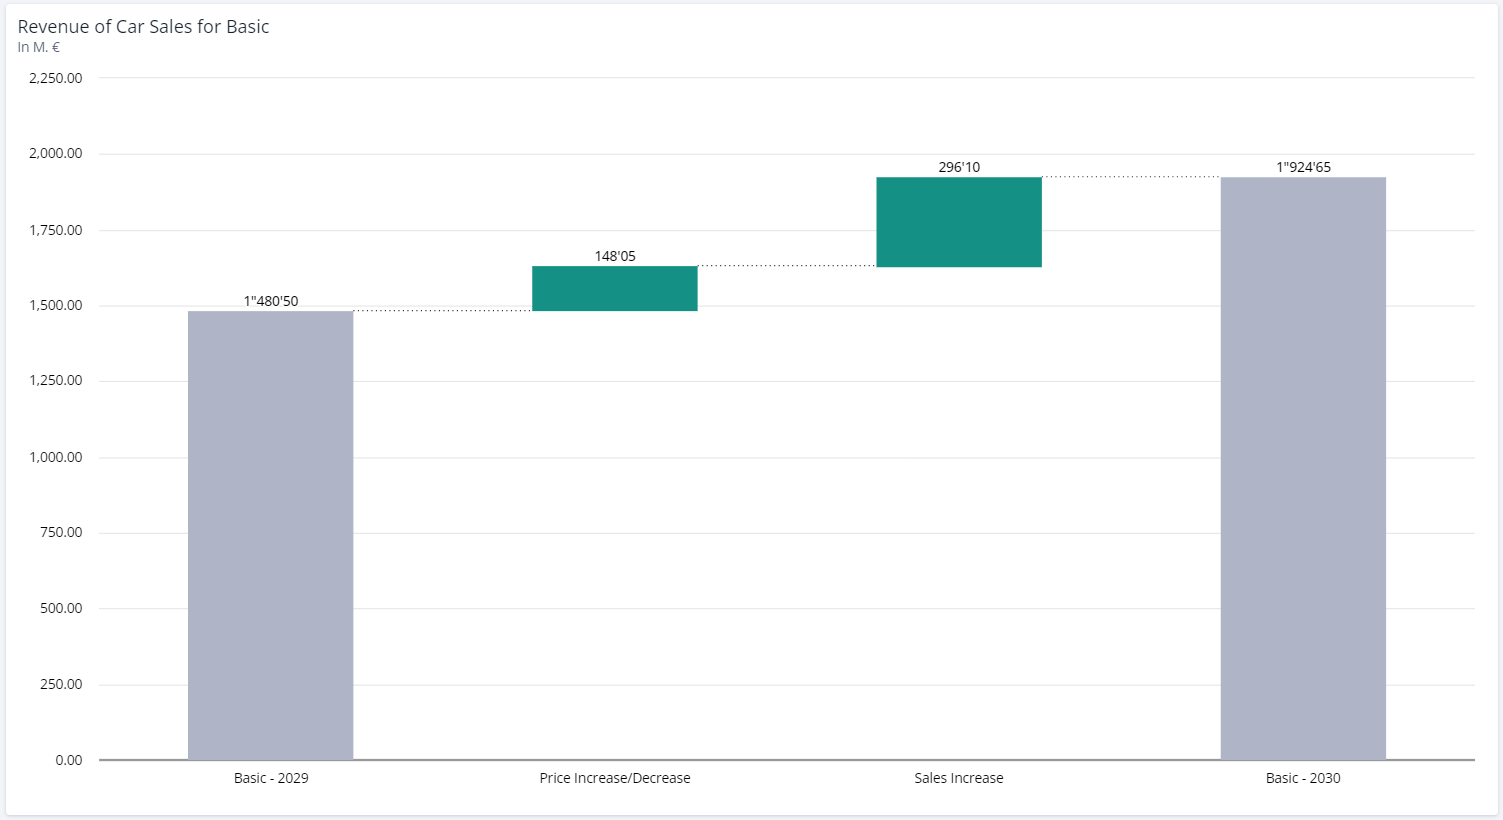
A Time Bridge shows the change between two or more points in time using the effects of assumptions or line-items.
In contrast, a Scenario Bridge can be used to analyze the change between two different scenarios in a specific period.
Creating a Time Bridge
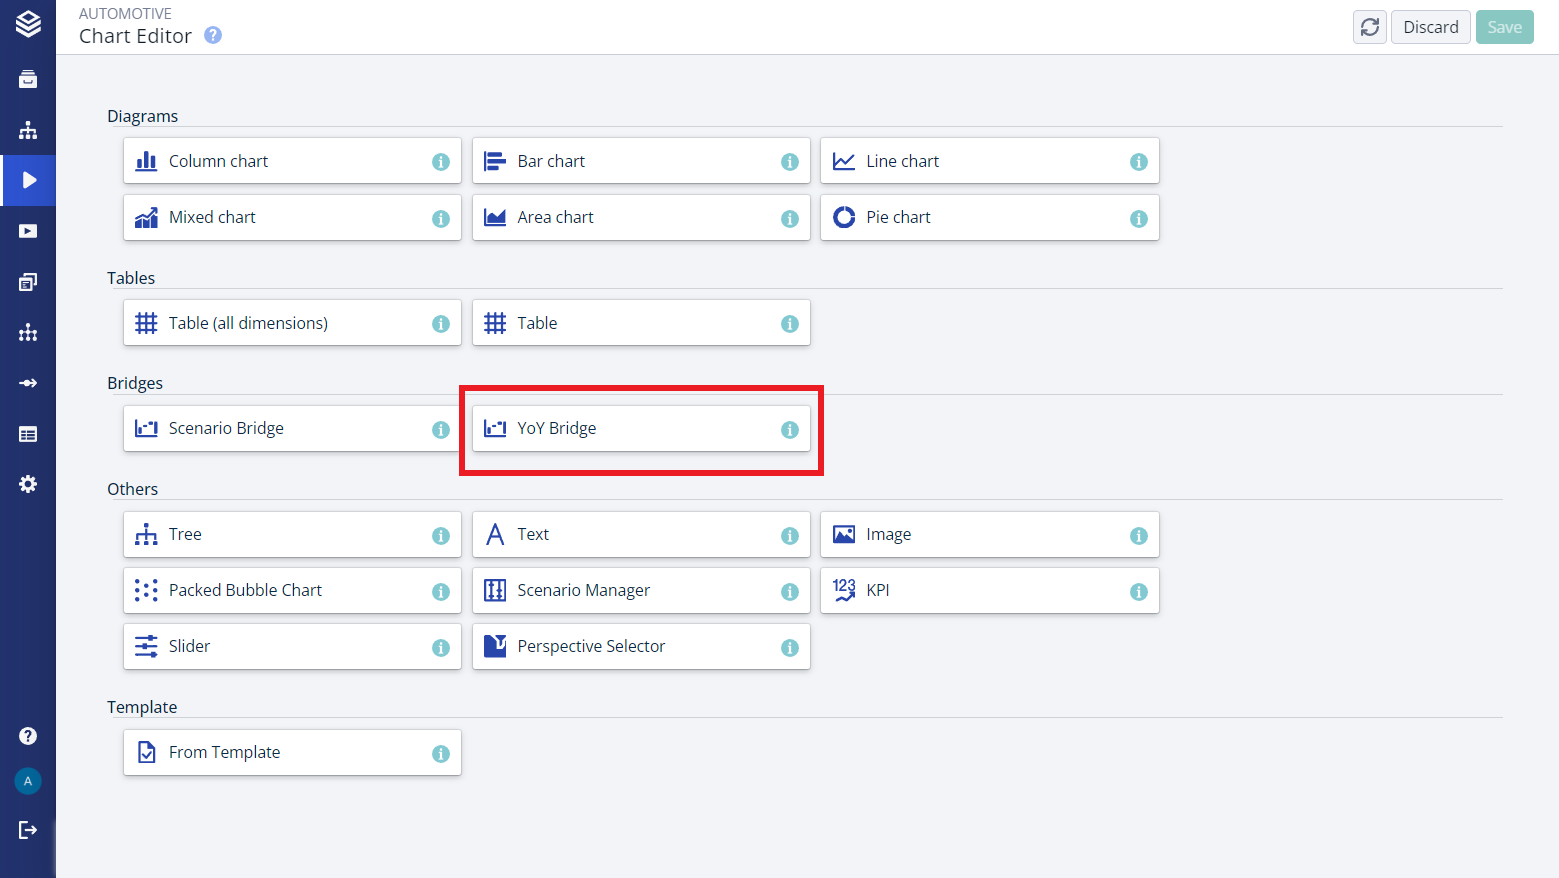
Click on the “Chart” button in the upper right corner on a worksheet.
Select “Time Bridge” in the chart selection.
Select a node which should be the base of your data
Select a scenario
Configuration Options:
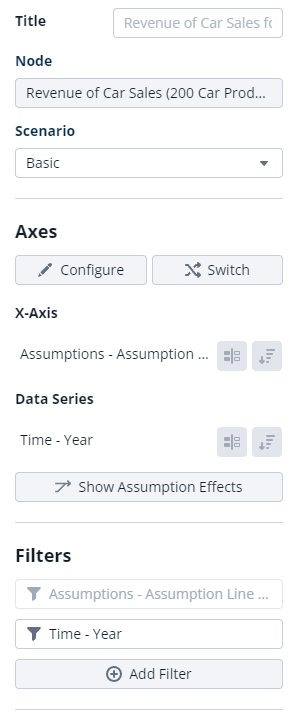
Node: The Time bridge displays the data of the selected node in the model. You can change the node after the bridge is created by selecting a different node in the chart editor.
Scenario Selection: The selected scenario gives you additional context when looking at your data. With this option, you can change the scenario of your Time bridge.
Configure Axes: You can use the “Configure” setting to either put single line-items or assumptions on the axis. By default, the bridge will be created with the configuration of “Years” as the data series and “Assumptions (total)” on the x-axis.
Period Selection: Per default, the Time bridge is always created on the last two years of your horizon. You can use the filter on “Time” in the chart editor to select other periods the Time bridge should show. Selecting e.g. 2017 and 2020 will result in a bridge with the summed-up effects of the three years. In case only a single period is selected, the bridge will automatically use the previous period as a reference point for the Time bridge.
You can switch between scenario and Time bridges by using the option Bridge between periods in the Bridge Settings.
Calculation Logic
To illustrate the calculation logic behind the effects of individual assumptions, let's consider the simple example of the node “Revenue”. Adjustments can be made using assumptions with a base effect, which means that the adjustment is carried into the following years. Alternatively, assumptions can be one-time adjustments without an effect on the following years.
Assumptions without base effect / one time:
2017 | 2018 | 2019 | |
|---|---|---|---|
Assumption 1 (no base effect) | +10 | +15 | +20 |
Assumption 2 (no base effect) | - | +20 | - |
Revenue | 10 | 35 | 20 |
Assumptions with base effect:
2017 | 2018 | 2019 | |
|---|---|---|---|
Revenue PY | - | 20 | 35 |
Assumption 3 (with base effect) | +10 | - | - |
Assumption 4 (with base effect) | +10 | +15 | +20 |
Revenue | 20 | 35 | 55 |
The calculation logic determines the individual effects for all assumptions that are active in the selected scenario between the two viewed periods.
A Time bridge for 17/18 or 18/19 would display the following effects:
Time Effect 17/18 | Time Effect 18/19 | |
|---|---|---|
Assumption 1 (no base effect) | +5 | +5 |
Assumption 2 (no base effect) | +20 | -20 |
Assumption 3 (with base effect) | 0 | 0 |
Assumption 4 (with base effect) | +15 | +20 |
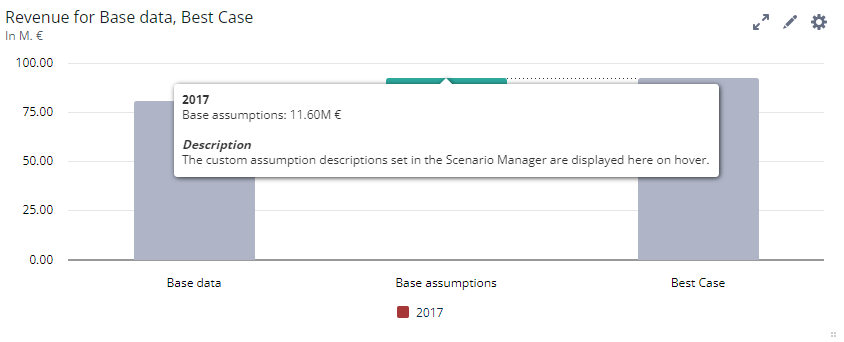
Assumptions Descriptions
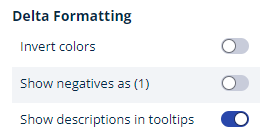
It is possible to show the assumption description in a bridge on hover over an assumptions bar.
Clicking on an assumption’s name will open its settings:
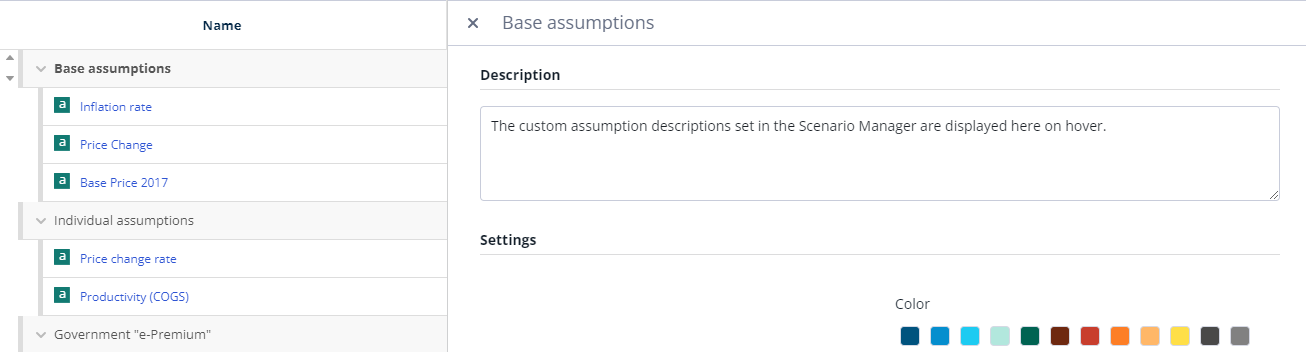
It is possible to set a custom description for this assumption in the description box. To display these descriptions on a chart on hover, enable the ‘show descriptions in tooltip’ setting in the charts inspector.