
Difference between YOY_REL(), YOY_ABS(), and RATIO(PY())
Basic Overview
When aiming to compare values across time periods, there are three very similar ways to do so. At first look, they appear to function in the same way; they do however possess small but important differences that can lead to vastly different results. It should be noted that each method has its own advantages and disadvantages, and there are use cases for all of them.
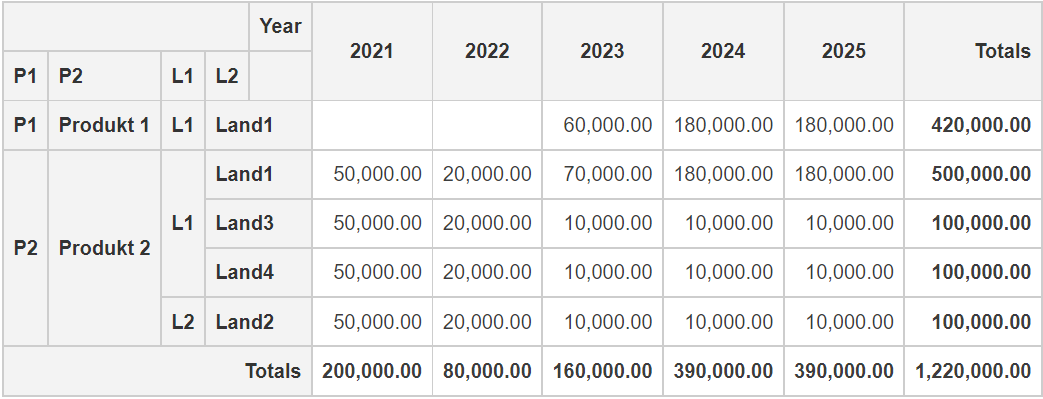
Let us assume the following base data:
| 2021 | 2022 | 2023 | 2024 | 2025 |
|---|---|---|---|---|---|
Land 1 | 50.000,00 | 20.000,00 | 130.000,00 | 360.000,00 | 360.000,00 |
Land 2 | 50.000,00 | 20.000,00 | 10.000,00 | 10.000,00 | 10.000,00 |
Land 3 | 50.000,00 | 20.000,00 | 10.000,00 | 10.000,00 | 10.000,00 |
Land 4 | 50.000,00 | 20.000,00 | 10.000,00 | 10.000,00 | 10.000,00 |
Using YOY_REL() here will yield the following results:
| 2022 | 2023 | 2024 | 2025 |
|---|---|---|---|---|
Land 1 | -60,00% | 250,00% | 357,14% | 0,00% |
Land 2 | -60,00% | -50,00% | 0,00% | 0,00% |
Land 3 | -60,00% | -50,00% | 0,00% | 0,00% |
Land 4 | -60,00% | -50,00% | 0,00% | 0,00% |
As expected, the results show the change from the previous year to the current one, or in other words, the percentage that the previous year has changed compared to the output year’s value. Values that did not change from one year to the next resulted in a 0% output value. However, if we look at “Land 1” in 2023 and 2024, we notice that the percentages do not correspond correctly to the changes that occurred. This is caused by the wrong aggregation of values over additional dimensions.
YOY_REL() calculates on the smallest possible instance, leaving out additional values that do actually contribute to the increased value of the following year. In this example, there are actually two different products in the base data, which can not be distinguished from the table.
YOY_REL() and YOY_ABS() always consider all dimensions in their calculation!
Using RATIO(PY()) will lead to a very different result:
| 2022 | 2023 | 2024 | 2025 |
|---|---|---|---|---|
Land 1 | 40,00% | 650,00% | 276,92% | 100,00% |
Land 2 | 40,00% | 50,00% | 100,00% | 100,00% |
Land 3 | 40,00% | 50,00% | 100,00% | 100,00% |
Land 4 | 40,00% | 50,00% | 100,00% | 100,00% |
In this case, the output for 2022 makes it clear that RATIO(PY()) results in the percentage of the previous year’s input value, that the input year’s value represents. 20.000 units in 2022 are 40% of the 50.000 units in 2021. Consequently, values that do not change over time, like all values between 2024 and 2025, result in a 100% output for the latter of the two years (2025).
This method is best used when there are dimensions that do not overlap; it only keeps shared dimensions and ignores the rest. Note that RATIO() can only be used in an endnote, meaning the output of the RATIO() function can not be used for any further calculations.
There is also the possibility of using RATIO(YOY_ABS(), PY()). This will lead to:
| 2022 | 2023 | 2024 | 2025 |
|---|---|---|---|---|
Land 1 | -60,00% | 550,00% | 176,92% | 0,00% |
Land 2 | -60,00% | -50,00% | 0,00% | 0,00% |
Land 3 | -60,00% | -50,00% | 0,00% | 0,00% |
Land 4 | -60,00% | -50,00% | 0,00% | 0,00% |
Apparently, this leads to the same results as YOY_REL(). However, the output values for “Land 1” are very different for 2023 and 2024. The result is acquired by calculating (360.000 / 130.000) - 1 = 1,7692, showcasing the different calculations of this formula combination.
The combined operation’s calculation differs from RATIO(PY()) only in that it subtracts 1 (100%) from the result of the division. This is because YOY_REL shows the ratio between two values, while YOY_ABS shows the difference between them. In order to get the ratio of the two values from their absolute differences, use the previously mentioned RATIO(PY()) combined operation.