
The Basic Concepts of Valsight
Learn about the core elements in Valsight: models, simulation workspaces, scenarios, assumptions and charts.
Valsight is built around the concepts of models, simulation workspaces, scenarios, assumptions, and charts. This article will give you a brief overview and description of each.
Models
Value driver models define the calculation logic of a project using multi-dimensional operations and connect them with data sources. They can be created using a graphical editor that visualizes the relationships and allows the addition of new elements simply per drag and drop. A model is created with nodes. nodes are connected to data or calculated from other nodes using an operation that allows combining nodes with simple mathematical operations or more advanced node operation functions.
The most important operations:
Simulation Workspaces
A simulation workspace is a sandbox that allows one to create simulation scenarios and visualize, analyze and compare them using charts and tables. A simulation workspace is always linked to an underlying model that defines the list of possible nodes and their calculation logic. It allows viewing any node of the model in charts, whereas any dimension can be used on the axes or as a filter. Simulation scenarios are local to the simulation workspace and are defined by creating a list of assumptions and assigning those assumptions to the simulation scenario. Each assumption describes a change to the base data and can be individually activated or deactivated for a scenario. This way it is easy to describe different alternatives or measures and combine them into what-if scenarios, discussing them live in meetings and even changing them on the fly.
Charts
A key activity in workspaces is the creation of charts. Charts are always calculated dynamically based on the underlying value driver logic and configured simulation scenarios. A chart describes the data to display by selecting which dimensions should be shown on the axes and optionally adding filters. The dimensions “Scenarios”, “Year”, and “Nodes” are treated specially as they should never be aggregated in a chart. Therefore they have to be either displayed on an axis or configured as a single select filter.
Supported chart types include:
Line Charts
Column Charts
Bar Chart
Stacked column/bar
Pie Charts
Area Charts
Mixed Charts
Tables
Waterfall Charts
Packed Bubble Charts
Scenario Bridges
Model Trees
More information
For more detailed information on how to visualize data with the supported charts please click here.
Scenarios and Assumptions
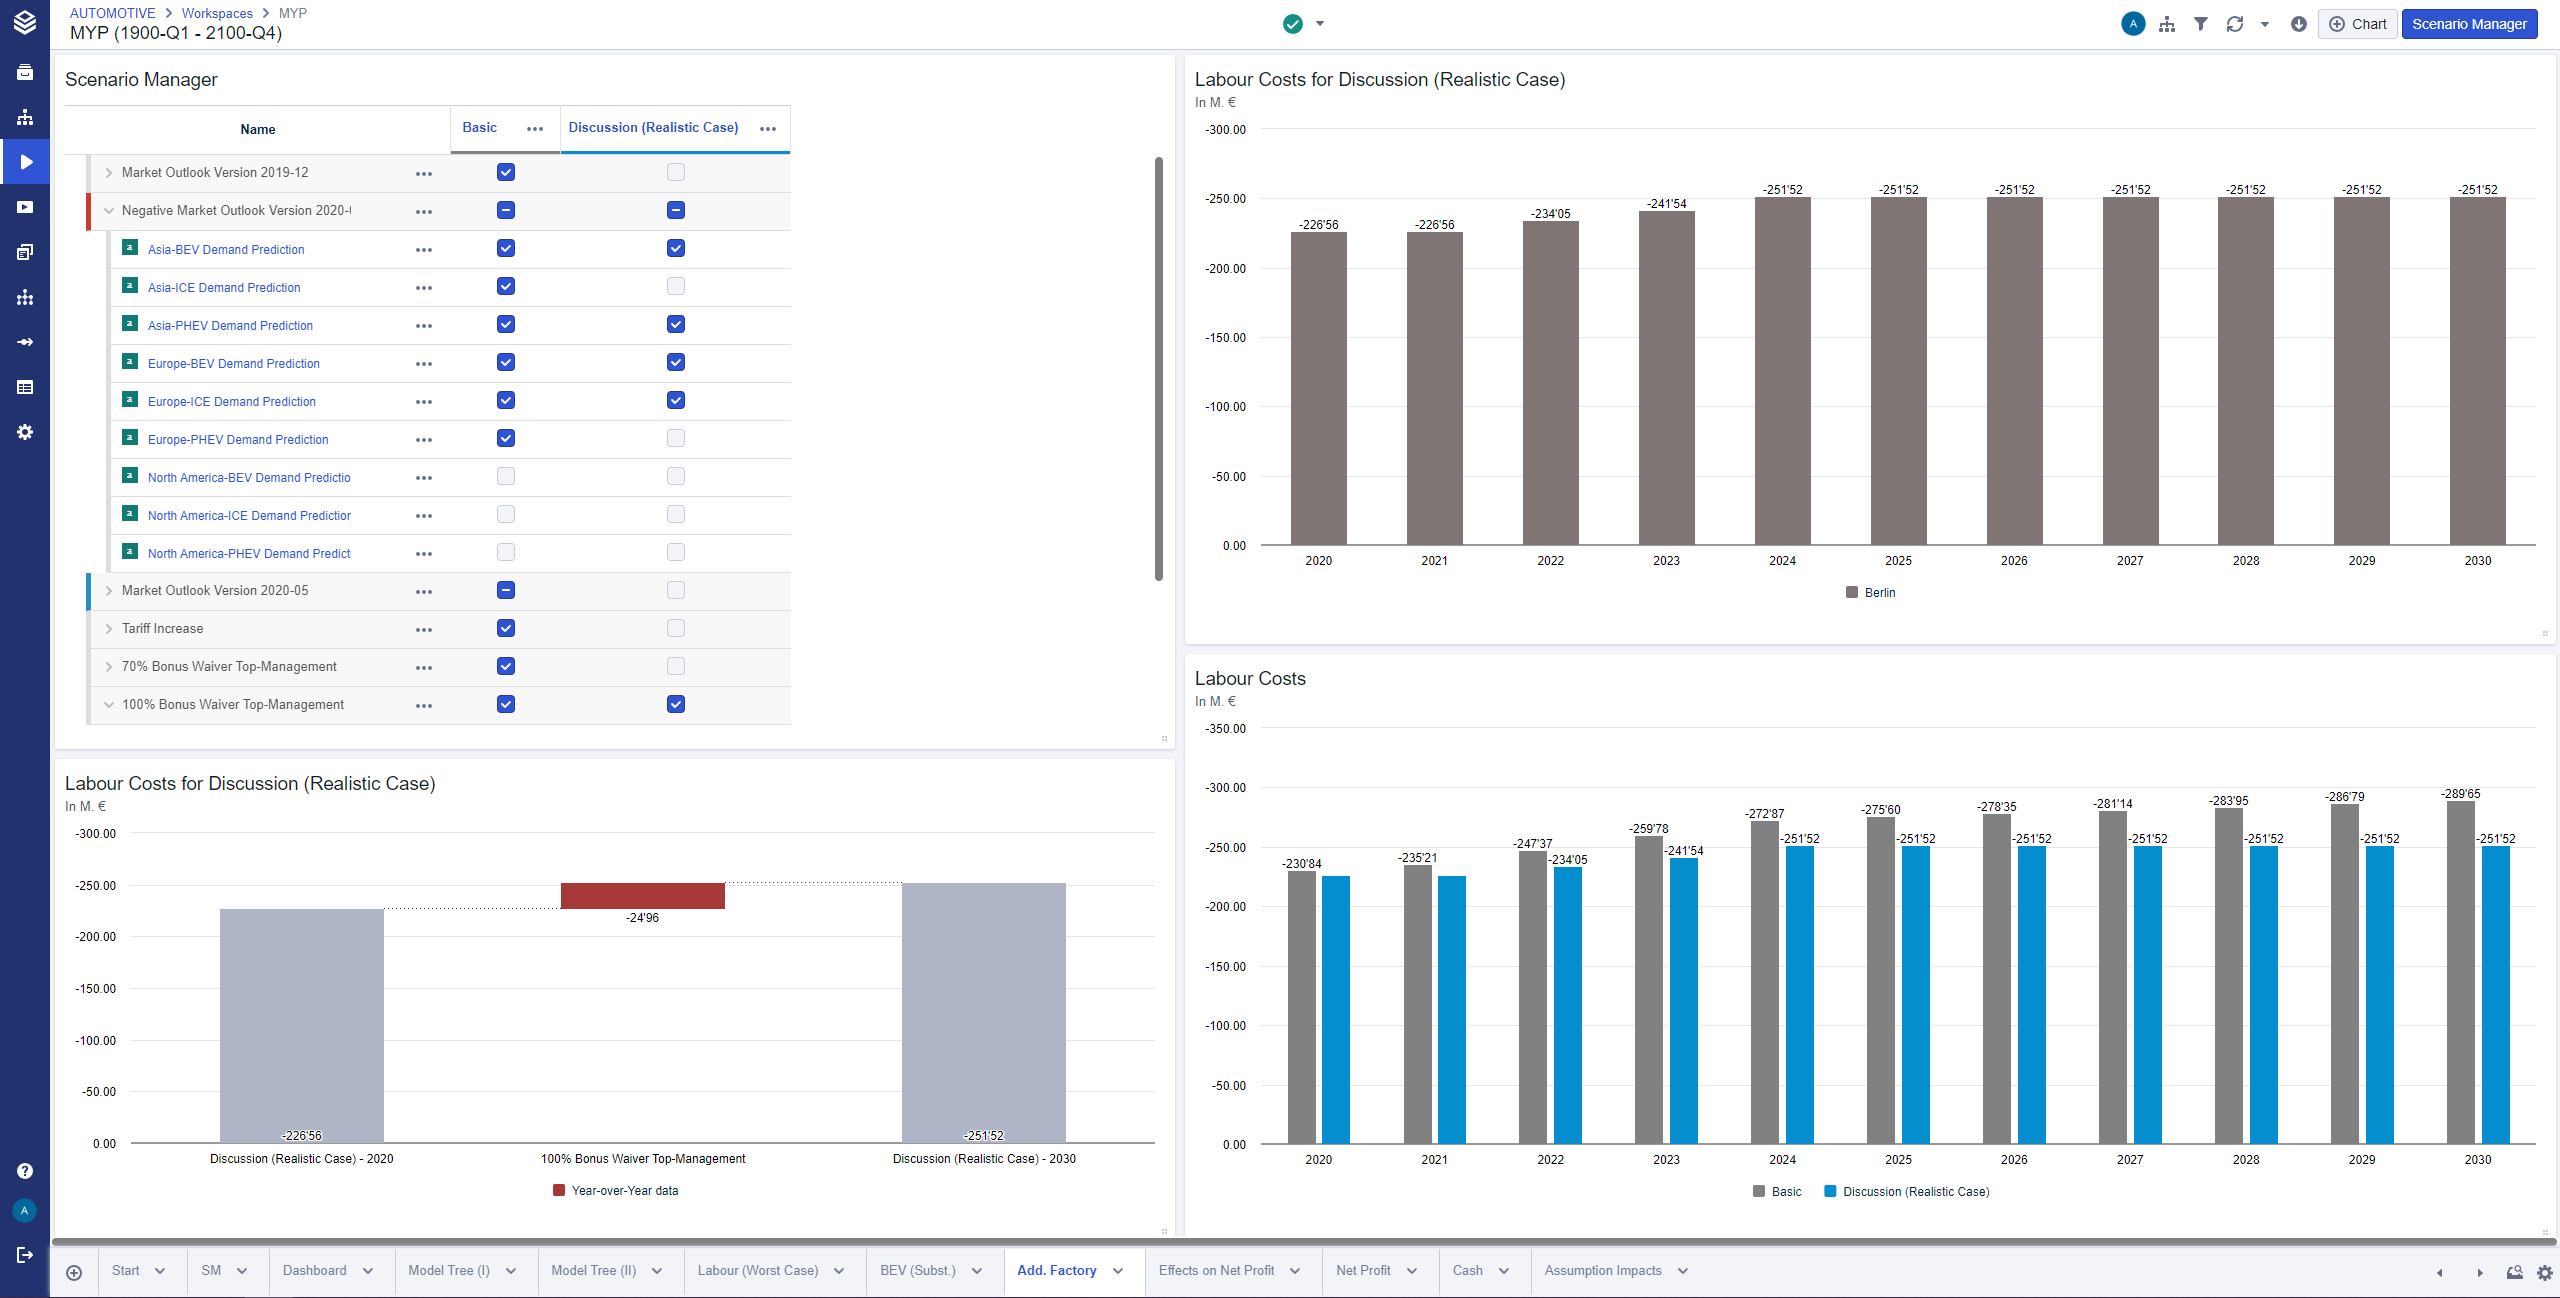
A simulation scenario groups a set of assumptions that describes how alternative actions impact nodes in the value driver model. Scenarios are defined using the Scenario Manager component, which is always visible in the first tab of a workspace and can also be added as a tile to any other tab. The Scenario Manager lists each assumption as one row and each scenario as a column. An assumption is active in a scenario when the respective checkbox in the row for the assumption and the column for the scenario is checked. Scenarios can be used as an additional dimension in charts to visualize and compare results graphically. Whenever something is changed, e.g. a new assumption is activated in a scenario or data of an assumption is changed, charts are always recalculated on the fly using the updated data so that all charts always display the current scenario configuration.
Assumptions describe changes to the base data of a model. These changes are always non-destructive and are only active if the assumption is activated for a simulation scenario so that the original data remains intact. The system stores assumptions as a delta to the base data, so that multiple assumptions affecting the same node can be combined in one simulation scenario.