
2. MDE Submodels
Base Data
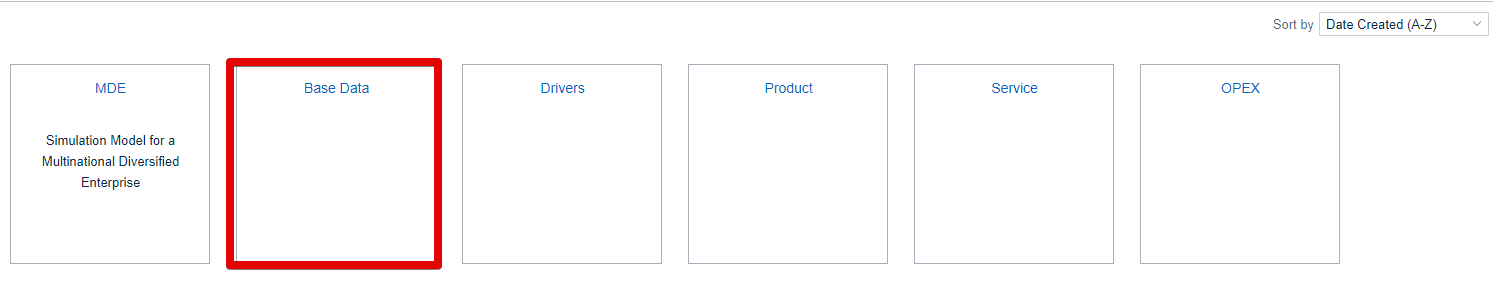
In this step, we create our first submodel, “Base Data”. It will serve us as a nexus between the uploaded data from our XLSX sheets and the created nodes and drivers.
First, we create blank data nodes 1-10. Afterward, we use the “Connect Data” button under the formula ribbon to add data according to the following table: Do not forget to change the unit settings accordingly and follow the naming.
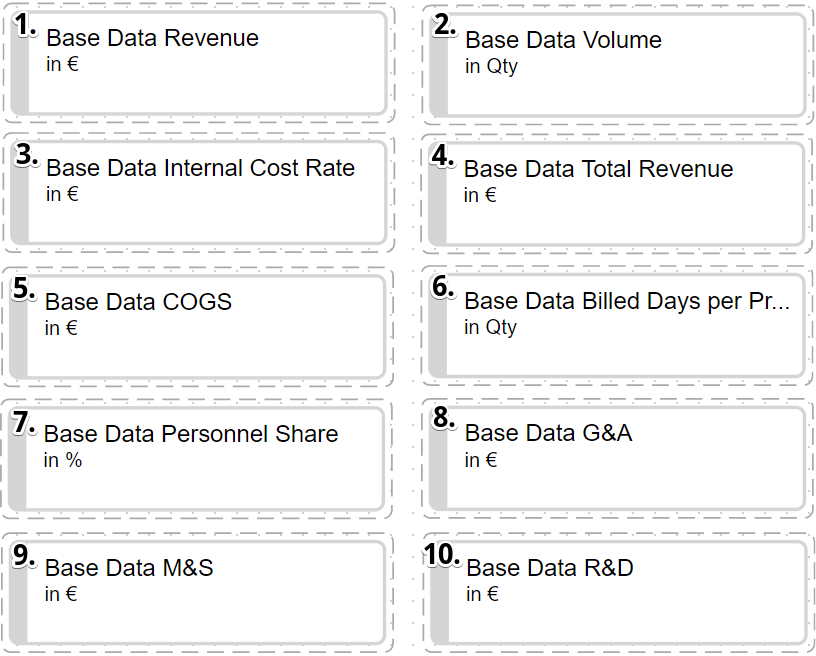
Node | DataSource | Table | Measure | Resulting fx | |
|---|---|---|---|---|---|
| 1 | Base Data Revenue | Base data | BaseData | Revenue |
|
| 2 | Base Data Volume | Base data | BaseData | Volume |
|
| 3 | Base Data Internal Cost Rate | Base data | FTEData | InternalCostRate |
|
| 4 | Base Data Total Revenue | Base data | ServiceData | TotalRevenue |
|
| 5 | Base Data COGS | Base data | BaseData | COGS |
|
| 6 | Base Data Billed Days per Project Type | Base data | ServiceData | BilledDays |
|
| 7 | Base Data Personnel Share | Base data | PersonnelSplit | PersonnelShare |
|
| 8 | Base Data G&A | Base data | OPEX | GA |
|
| 9 | Base Data M&S | Base data | OPEX | MS |
|
| 10 | Base Data R&D | Base data | OPEX | RND |
|
(If you forgot to upload your data, see the last step and do that first.)
Drivers
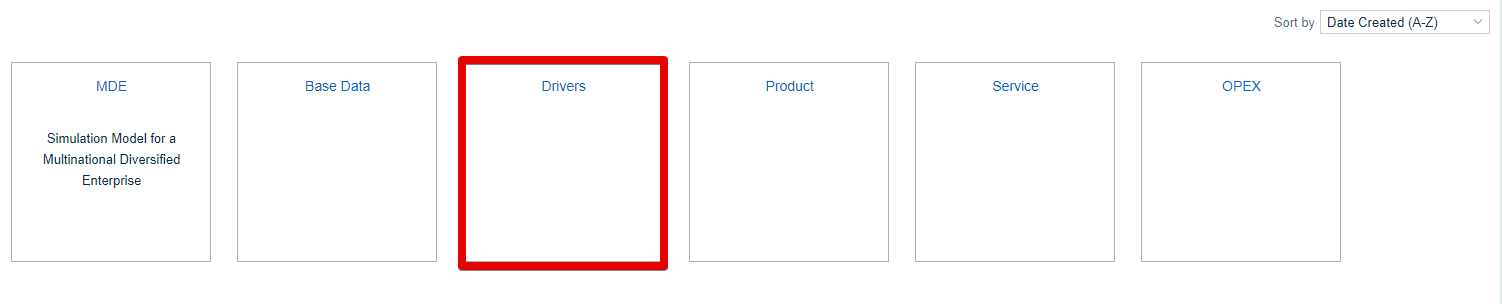
In our next step, we focus on the "Drivers" model. The drivers are our ways to simulate the effects of outside drivers as well as our own actions.
What we can achieve with the following Formulas:
with the EXPAND formula, we copy our desired Input for chosen dimension level (e.g. Country level of Location Dimension) across all its level values (e.g. Germany)
with the ROLLFORWARD formula, we take the most recent value in the base and continue data (Base Data Volume) and the drivers ( Market Growth)
with the FILTERformula we can select or exclude data based on their dimensions level values (e.g. keeping only data for the level value Germany in the dimension level Countries of the Location dimension)
with the EXPANDSINGLEformula, we set a chosen level ( e.g Year) to a specific level value (=dimension member) ("2018") on a node or value
Once again we create the 9 driver nodes and type in the command by opening each nodes operation editor (fx):
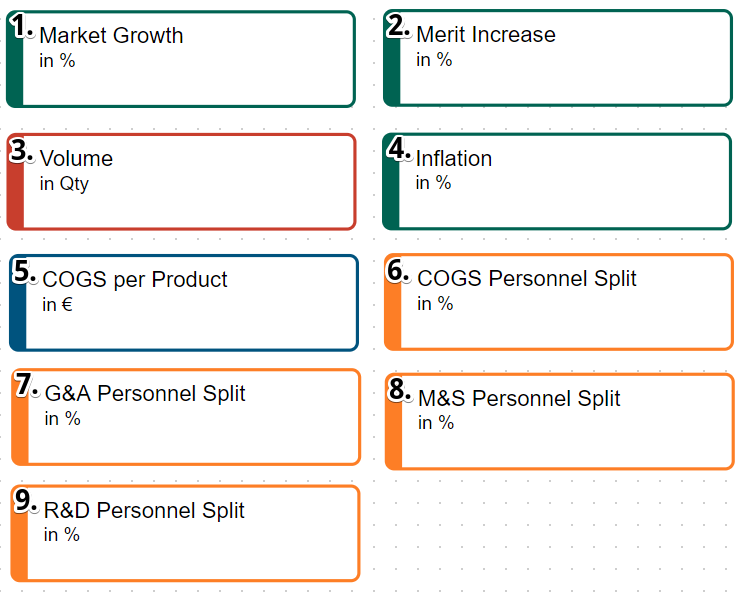
Use | Needed fx (Highlighted according to the formula explanation above) | |
|---|---|---|
| 1 | With this node, we want to simulate effects of different market developments on our sales and associated variable costs. We want to start off with 0 development for both country and years and simulate changes from that baseline. |
|
| 2 | With merit increase, we simulate the increase of Salary for different groups which affects our costs. We start again with zero salary increase for all groups and years. |
|
| 3 | The volume is the past volume increased with the predicted market growth. |
|
| 4 | Inflation has affects on our costs and the sales price. We want to keep it at zero for all countries and years and then adjust it later on. |
|
| 5 | The Cost of Goods Sold per Product node should only cover the costs for products and exclude the services cost. We need the past total product cost and divide it with the past product sales volume to have a cost per each product. The most current data point should be a starting point for the future estimation. |
|
| 6 | To model the cost increase following salary changes, we need the share of COGS belonging to personnel. |
|
| 7 | General and Administrative: The same use case as for the COGS Personnel Share. Please note that including a number manually in a formula can make the model less readable and harder to change, keeping the data in Excel Sheets results in easier model management. However, it is sufficient for our use case. |
|
| 8 | Marketing and Sales: See 6 & 7. |
|
| 9 | Research and Development: See 6 & 7. |
|
If everything went well, your model should look somewhat like this:
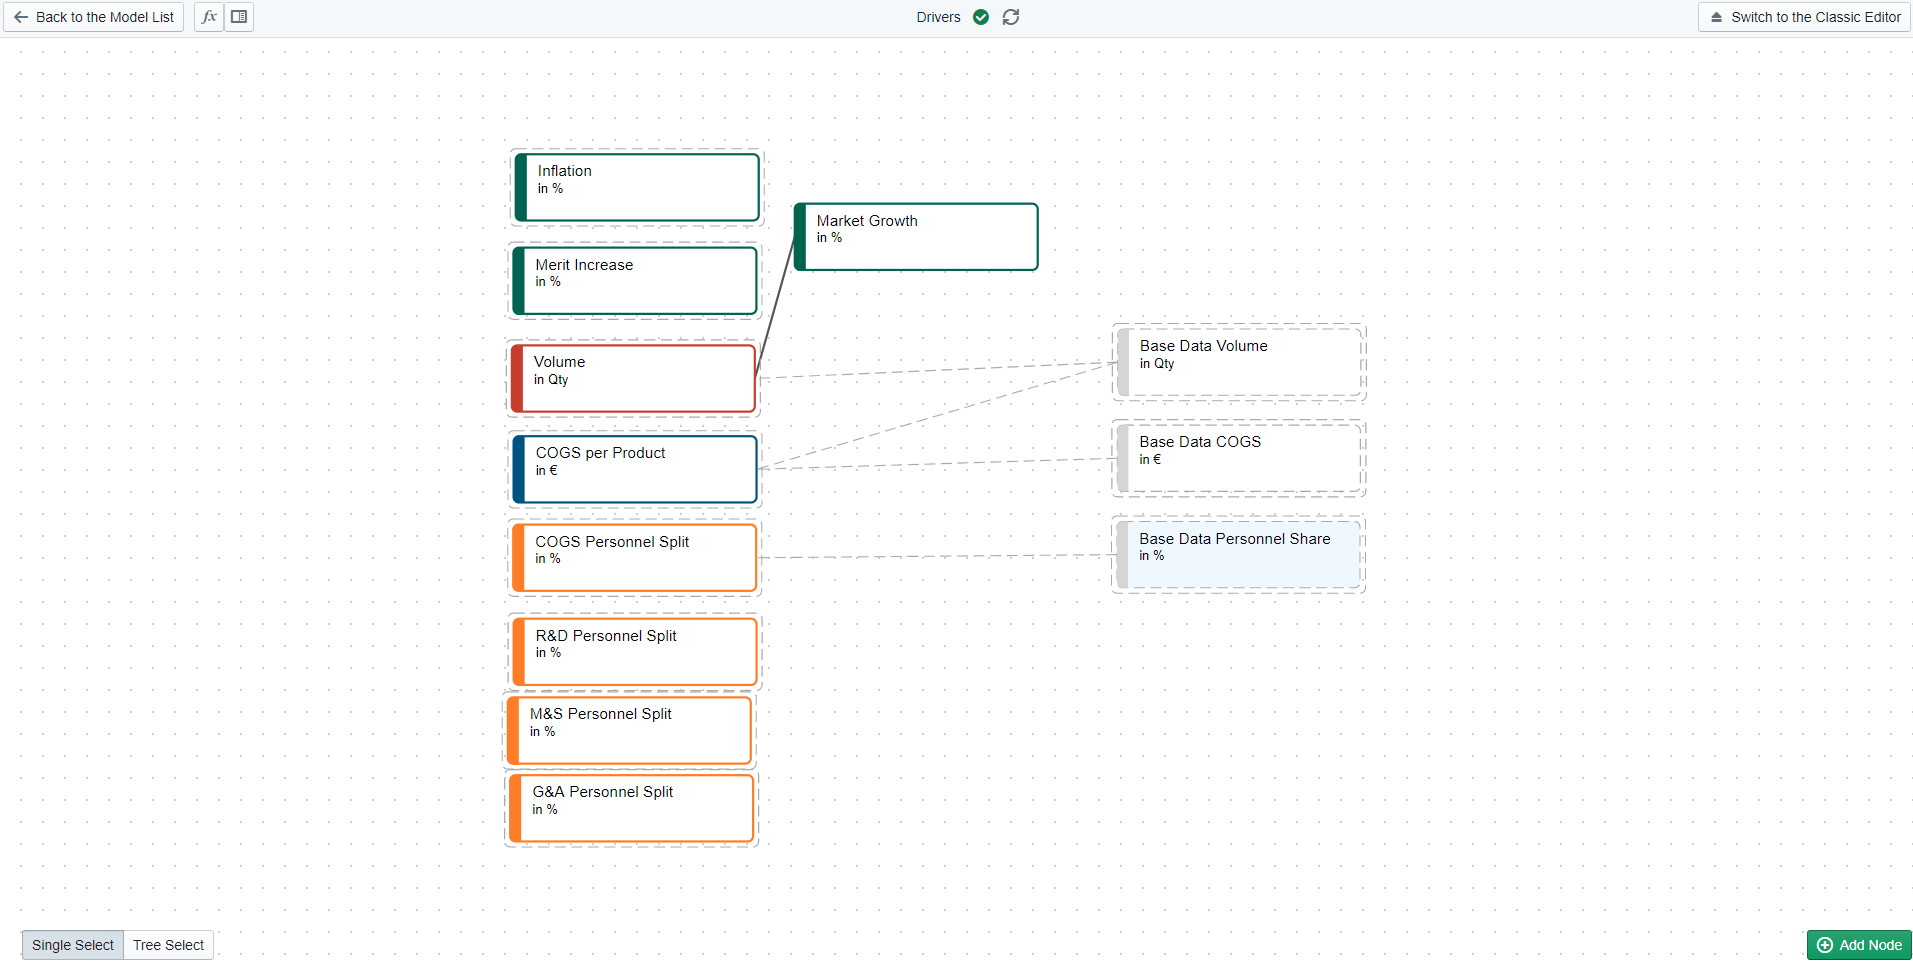
You can see the grey nodes are from the submodel "Data Base".
Next Step
Congratulations on getting to know the four most important formulas of Valsight: EXPAND, EXPANDSINGLE, ROLLFORWARD & FILTER. With their combinations and simple arithmetic operations, you can model most business relationships.