
3. MDE Product
We will now start creating our "Product" submodel to determine gross profit per product.
We will start from the top and move them through the tree. The first step is gross profit.
Gross Profit
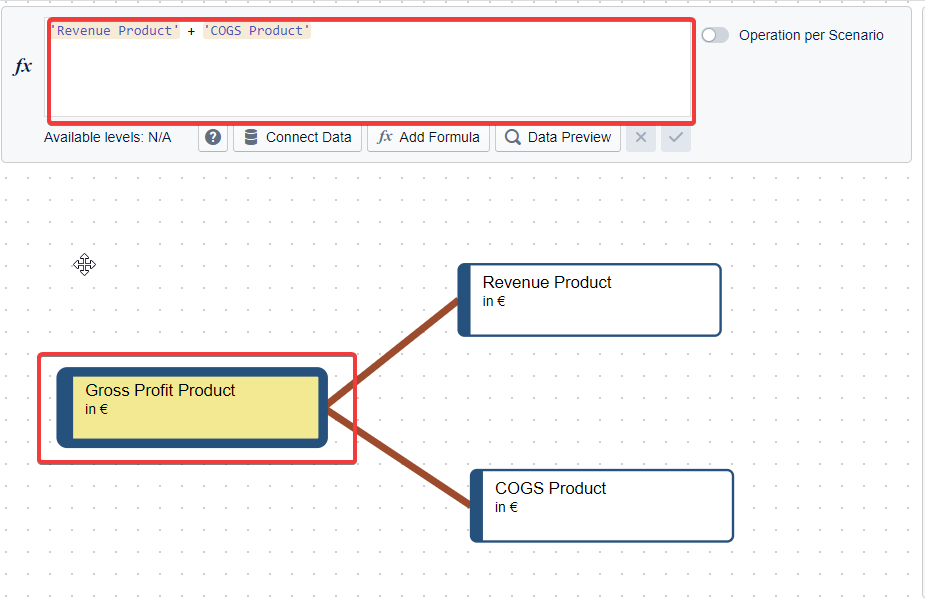
The gross profit is the total of our product revenue after subtracting the associated costs of goods sold (COGS). Remember that the best practice of Valsight is to have all data concerning costs stored as negative numbers. Therefore we can create the “Gross Profit Product” node by adding “Revenue Product” and “COGS Product” nodes. Create these three nodes and join them, for example with drag and drop.
Gross Profit Product
'Revenue Product' + 'COGS Product'
'Revenue Product' + 'COGS Product'
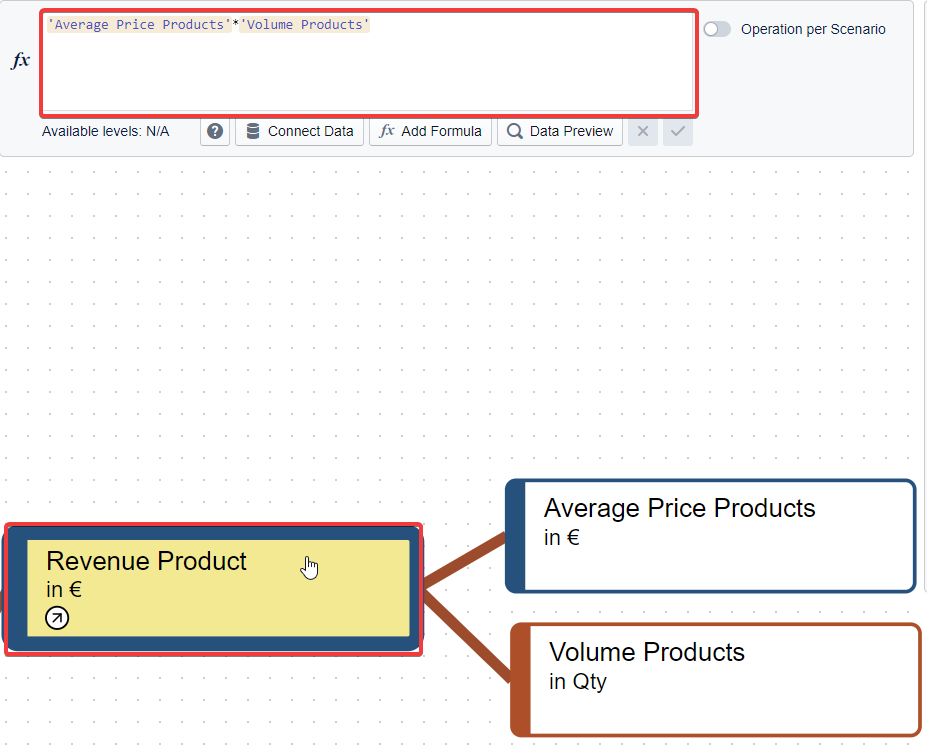
To determine our product revenue, we multiply the average price of our products by their volume. Create the nodes first and enter the multiplication into the “Revenue Product” formula:
Revenue Product
'Average Price Products'*'Volume Products'
COGS Product
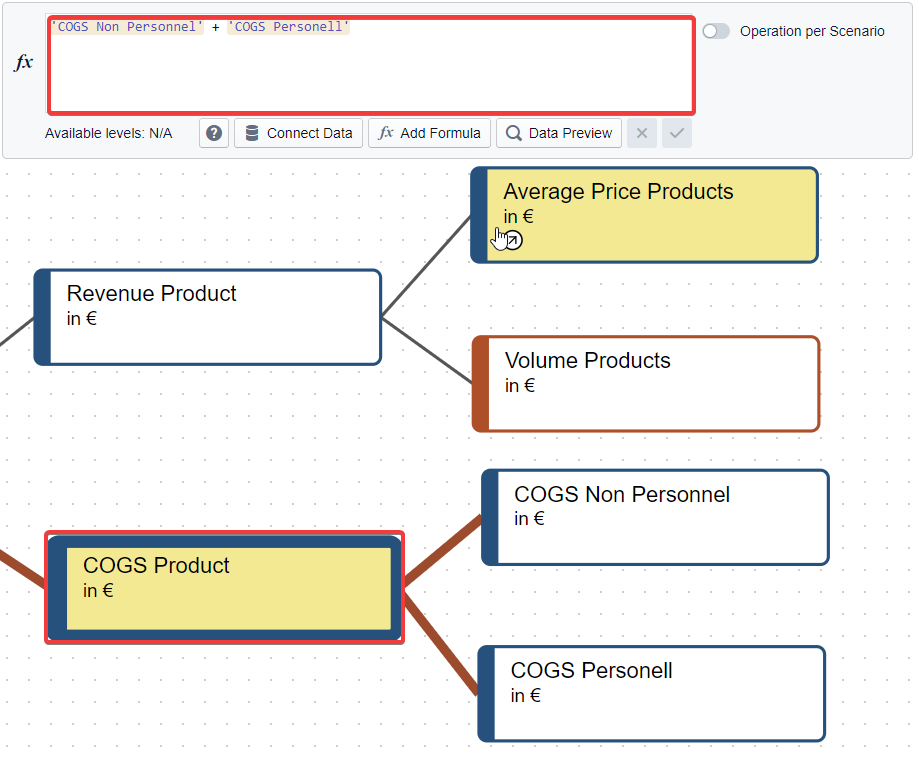
We model our products' cost of goods sold(COGS) as the sum of the non-personnel and personnel COGS. Create these 2 parts and sum them.
COGS Product
'COGS Non Personnel'+'COGS Personnel'
Prices, Volume, COGS (Non) Personnel
To calculate the 4 following nodes, we use the base data and drive them. The following table has the required explanations and formulas.
Node | Explanation | fx(Color Links the explanation and formula) | |
|---|---|---|---|
| 1 | Average Price Products | To calculate the average price of products, we divide the past revenue by the past volume. We are only interested in the products. We use the most recent data point as projection for the future. |
|
| 2 | Volume Products | We filter the volume projection from the Drivers model. |
|
| 3 | COGS Non Personnel | To calculate the non-personnel part, we first derive the non-personnel cost ratio by multiplying the personnel ratio by -1 and then adding 1. We then multiply this ratio by the cost per product and the product volume to get the total non-personnel cost. We use only the values for the year 2018 (see *). The most recent data point is then rolled forward into future periods using inflation and volume. |
|
| 4 | COGS Personnel | The same as 3. but with personnel split and merit increase as the cost increase driver. |
|
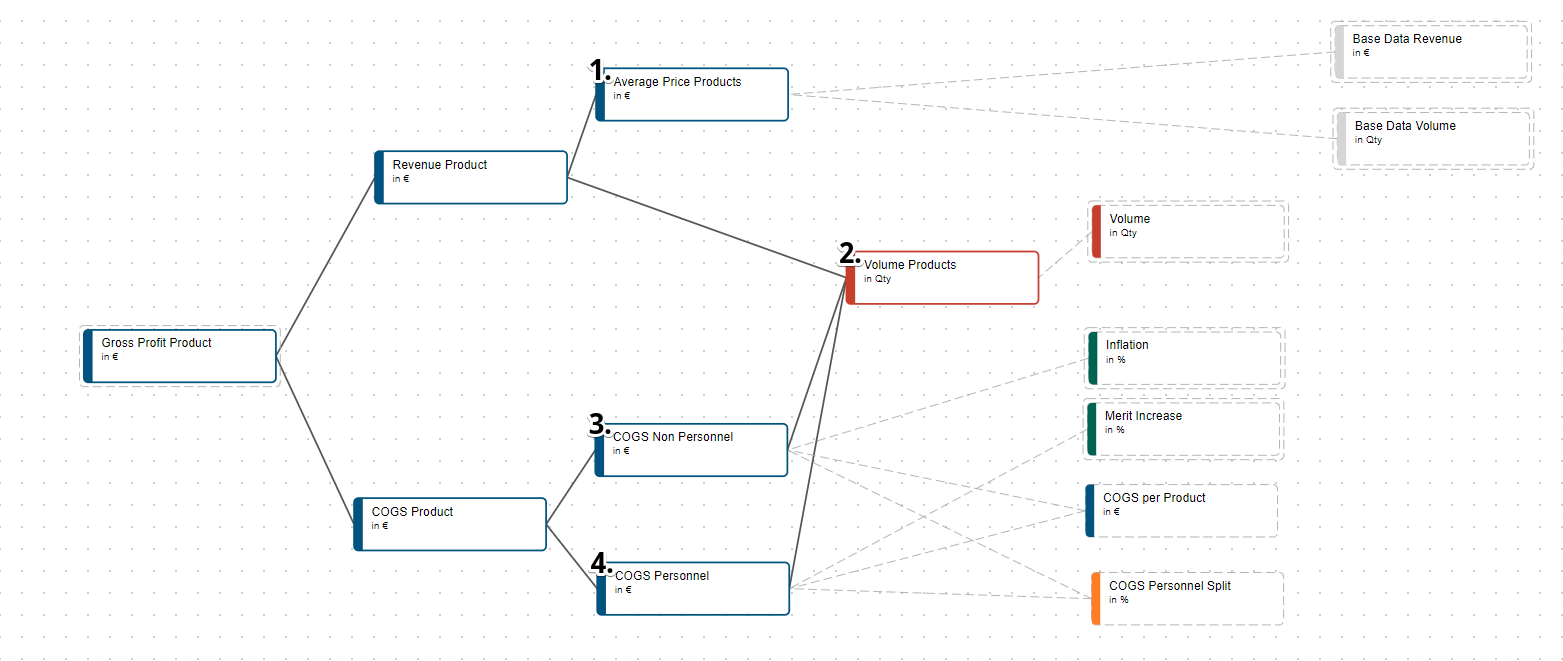
If you entered all the commands correctly your driver tree should look like this.
Since we created a separate "Driver" and "Base Data" submodel, we are able to see which driver and data points are accessed through which node by simply following the dotted lines.
Next Steps
Now you learned how to join complex formulas together in order to model even the toughest relationships. You will find that the next 2 sub-models will be a breeze for you now. Start with the Service sub-model.