
6. MDE P&L
Profit
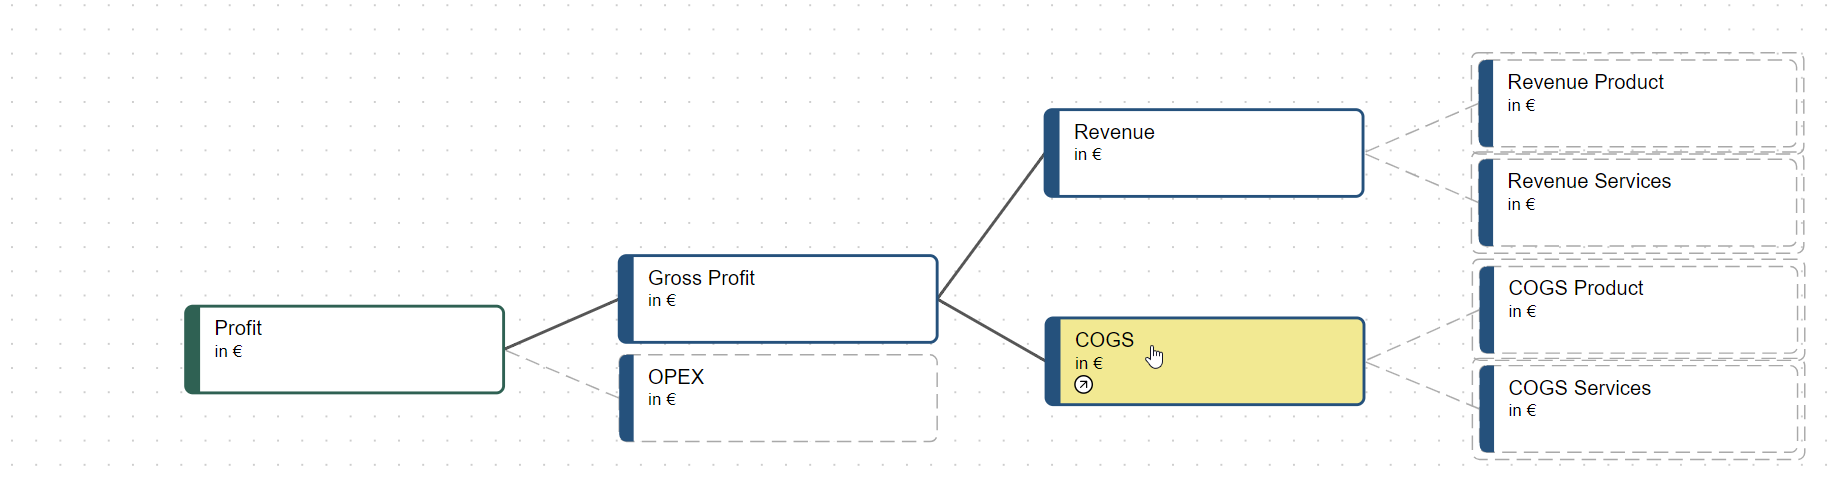
The last step is to create a simple P&L hierarchy. All you need are these four nodes, link them to our appropriate submodels and join them using plus sign and you are done. Here are the formulas:
Node | fx |
|---|---|
Profit |
|
Gross Profit |
|
Revenue |
|
COGS |
|
If you have done everything right, the final model should look like this:
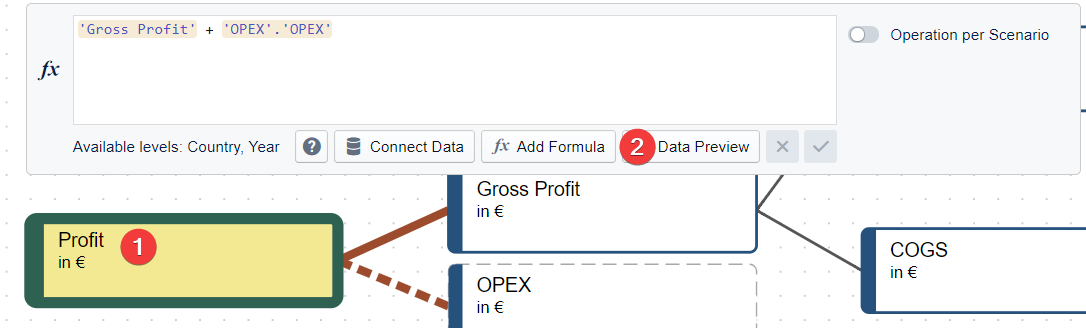
As a last check, you can use the data preview button on the profit node to check if all of your formulas function the way they should:
Correct result
Country/Year | 2018 | 2019 | 2020 | 2021 | Totals | ||
|---|---|---|---|---|---|---|---|
DEU | 14,869,422.49 | 14,869,422.49 | 14,869,422.49 | 14,869,422.49 | 59,477,689.97 | ||
FRA | 62,106,542.25 | 62,106,542.25 | 62,106,542.25 | 62,106,542.25 | 248,426,169.00 | ||
Total | 76,975,964.74 | 76,975,964.74 | 76,975,964.74 | 76,975,964.74 | 307,903,858.97 | ||
Congratulations
You are now able to create complex models on your own. We suggest you use your new model to create a workspace with 2-3 scenarios and a few dashboards to understand the power of what you just created.
A good point to start learning about Workspaces is the Visualizing Data section of our documentation.