
Aggregation Settings
Overview
'Aggregation' is the process of reducing a data set's complexity by summarizing multiple values.
This typically happens when viewing a data set with multiple dimensions in a chart that displays the data using only a subset of the available dimensions.
In Valsight, you have the option to aggregate your data based on a number of options.
The aggregation type of a node defines how the data is summarized and shown.
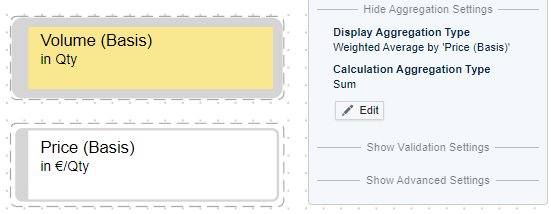
The setting to define which aggregation type is applied can be found in the modelling section, in the node editor under "Show Aggregation Settings".
There are two aggregation setting types that influence the aggregation of your data ( 1. Display Aggregation Type, 2. Calculation Aggregation Type).
The effects of those two settings are visible when for example looking at the data in a tree view, as there the data is often shown on a per-year level. It also affects how the data is "Rolled up", if the ROLLUP or DROPLEVEL function is used.
Aggregation Types
Among the standard options you will find:
Aggregation Type | Description |
|---|---|
SUM (default) | Sum of all values. |
AVG | The average value. To calculate weighted averages, see below. |
MIN / MAX | The minimal/maximal value (on that specific aggregation level), e.g. can be a min-value per year & product |
CLOSINGSUM (Closing Date-Sum) | The sum of the values at the end of a period/dimension (e.g. sum of all Q4 revenue made from 2020-2022). |
CLOSINGAVG (Closing Date-Average) | The average value of all values at the end of a period/dimension (e.g. average of all Q4 revenue made from 2020-2022). |
OPENINGSUM (Opening Date-Sum) | The sum of the values at the beginning of a period/dimension (e.g. sum of all Q1 revenue made from 2020-2022). |
OPENINGAVG (Opening Date-Average) | The average value of all values at the beginning of a period/dimension (e.g. average of all Q1 revenue made from 2020-2022). |
NONE | The node will not be shown aggregated. |
Weighted Average by | You can specify a node that is used for weighting, e.g. use volume to weigh the price to get an average price of products sold. See details below. |
LAST | The last value from data will be shown, e.g. in a year dimension with data uploaded from 2024-01 till 2024-12, the LAST aggregation will take the value from 2024-12. If there is only data entered until 2024-05, then the LAST aggregation uses this data point. The value '0' counts as a data point. |
FIRST | The first existing value from data will be shown. The value '0' counts as a data point. |
Examples
To explain each aggregation type, imagine the following data set regarding Revenue by country and year:
Country | Year | Revenue |
|---|---|---|
DE | 2023 | 100 |
US | 2023 | 200 |
DE | 2024 | 150 |
US | 2024 | 250 |
SUM, AVERAGE, MIN, MAX
Using these four different types, the aggregation results would look like this:
Year | SUM | AVG | MIN | MAX |
|---|---|---|---|---|
2023 | 300 | 150 | 100 | 200 |
2024 | 400 | 200 | 150 | 250 |
CLOSINGSUM, CLOSINGAVG, OPENINGSUM, OPENINGAVG, LAST and FIRST
The aggregation functions CLOSINGSUM and CLOSINGAVG are like the traditional SUM and AVG with the exception of how the dimension is aggregated.
To outline the mechanics, let's consider the example from above for 2023 with quarters.
Country | Quarter | Year | Revenue |
|---|---|---|---|
DE | Q1 | 2023 | 15 |
DE | Q2 | 2023 | 15 |
DE | Q3 | 2023 | 20 |
DE | Q4 | 2023 | 50 |
US | Q1 | 2023 | 30 |
US | Q2 | 2023 | 30 |
US | Q3 | 2023 | 40 |
US | Q4 | 2023 | 100 |
When aggregating the data on year using CLOSINGSUM or CLOSINGAVG, the aggregation will take the CLOSING value of the period (which is Q4) and calculate the SUM or AVG over all countries.
Year | CLOSINGSUM | CLOSINGAVG |
|---|---|---|
2023 | 150 | 75 |
When there is no closing value (e.g. the last month in a year) there will be no value for that period.
When aggregating the data on year using OPENINGSUM or OPENINGAVG, the aggregation will take the opening value of the period (which is Q1) and calculate the SUM or AVG over all countries.
Year | OPENINGSUM | OPENINGAVG |
|---|---|---|
2023 | 45 | 22,5 |
When there is no opening value (e.g. the first month in a year) there will be no value for that period.
When aggregating the data on country and year using the LAST aggregation, the data will show the last value of DE in 2023 and the last value of US in 2023.
Year | Country | LAST |
|---|---|---|
2023 | DE | 50 |
2023 | US | 100 |
When aggregating the data on country and year using the FIRST aggregation, the data will show the first value of DE in 2023 and the first value of US in 2023.
Year | Country | FIRST |
|---|---|---|
2023 | DE | 15 |
2023 | US | 30 |
Weighted Average by
The standard aggregation types only use the data of the node itself. However, typical drivers are cost ratios, prices, etc that must be weighted by a volume to make sense on an aggregated level. The weighted average aggregation setting allows you to define such a node. When using the weighted average, keep the following in mind:
The weighting node needs to have at least the levels of the node.
The weighted average is not supported for nodes using the RATIO function.
The average is calculated as 'Node' * 'Weight' / 'Weight'. When using the node in a chart, the aggregation to the requested chart dimensionality happens individually for the numerator ( 'Node' * 'Weight') and the denominator ('Weight') before the division and always using SUM as aggregation method (independent of the aggregation settings of 'Node' and 'Weight').
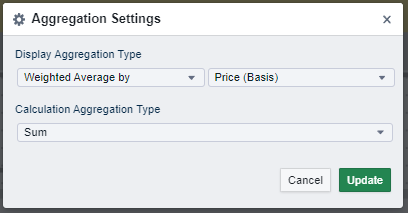
Two Types of Aggregation Settings
In the aggregation settings, users can choose between "Display Aggregation Type" and "Calculation Aggregation Type".
Display Aggregation Type
The display aggregation settings relate to the numbers displayed in the simulation workspace (e.g tree charts or tables).
The setting helps to individually configure charts based on relevant numbers and dependent on the use case.
Example:
Company A is selling 3 sorts of apples and needs information about the average price of an apple over all sorts sold for the year 2020.
Aggregating the data based on 'SUM' or 'AVERAGE' would not help company A as neither setting provides relevant or useful information for the request.
Therefore, the 'Display Aggregation' - setting is used. Herewith, the company can display the needed information in the workspace (e.g. for a presentation) without directly changing the calculation of the model.
Calculation Aggregation Type
The calculation aggregation settings are purely used for the background calculation of data in the model.
Changes can only be set when the display aggregation setting is set to 'None' or 'Weighted Average by'.
The settings of this option are not shown in the simulation workspace.