Skip table of contents

Line-Items

Basic Overview

Line-items are the instance of change to your base model. They affect a single node and can filter its content to apply even more specific changes.

By creating and combining line-items, you can build your simulation on a granular level. Line-items contain changes to the values of a node. These changes are stated either as a relative change (%) or as absolutes. Additionally, a line-item can consist of multiple variants, which are alternative versions of the same line-item based on the same node. This can be useful for certain exclusive assumptions, like “pessimistic” or “optimistic” market growth.

Like assumptions, line-items can be duplicated.

Creating a Line-Item

To add a line-item to your assumption, click on the “+” button on an assumption.
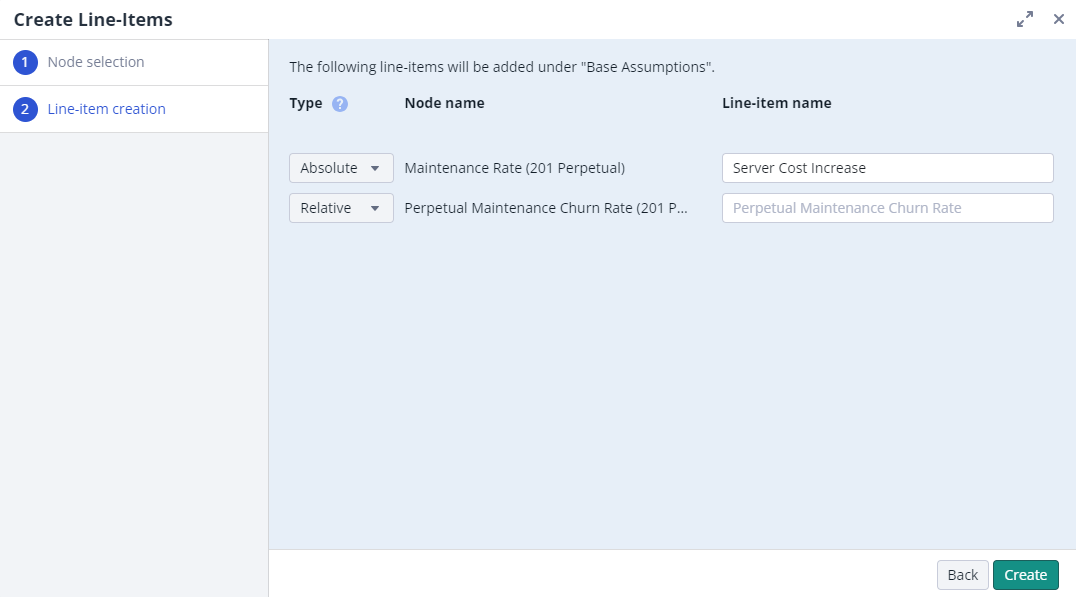
In the first step to create a line-item, you can select one or multiple nodes for which you wish to create line items.

All line items are “Absolute” by default. In the next step you can mark some or all as “Relative” as well as assign a name for each line item.

Absolute Line-Item:

  • Used to enter absolute values as the change to your base data

  • Has a fixed dimensionality which cannot be changed

Relative Line-Item:

  • Used to enter relative values as the change to your base data

  • The dimensionality of a relative line-item can be adjusted

    • In a relative line-item it is possible to select a hierarchically higher level in the dimensionality, which will aggregate the lower level values into the new level
      E.g. The line-item is based on ‘Months’ in the ‘Time’ dimension. By changing the dimensionality and selecting ‘Year’ from the ‘Time’ dimension, all the values from ‘01-2023’ till ‘12-2023’ will be aggregated to ‘2023’.

Line-Item Data & Details

To see the data of a line-item, click on the name the line-item.

The data view will open on the right side of the screen. In the columns of the data table are the levels of your line-item, the ‘Base’ that comes from the model, the ‘Change’ column, the ‘Result’ column, and a column where you can enter a comment or description for each row.

Setting filters for the columns on that screen can be used to temporarily focus the view onto the data. After the next browser refresh or after leaving the data view, these filters have been resetted.

To see the details of your line-item, click on the “Details” button in the upper right corner. On that screen, you can see more details of your line-item.

Pivoting the Line Item Data Table

Pivoting the Line Item Data Table enhances data visualization and entry by allowing the time dimension to be displayed in columns rather than in rows. This is particularly beneficial for faster adjusting data or copying and pasting data from spreadsheets. To access this feature, select “Change View” or “Results View” from the “All Details” dropdown within a line item view.

  • "Change View" simplifies entering expected changes (e.g., a 2% sales volume increase in 2025).

  • "Results View" allows inputting desired outcomes (e.g., desired result of 4% increase in sales volume in 2025).

image-20240408-141013.png

Adjusting data in one view dynamically updates the other, enabling comprehensive analysis and easier data management.

Manage Levels

To change the dimensionality of your relative line-item, use the “Manage levels” button in the details view.

This dialog shows the levels of the dimensionality of your line-item. For relative line-items it is possible to delete or add levels.

Match Node

In case your line-item does not match the dimensionality of the underlying node, a warning in the data view and an extra button will be displayed.

Using this button (“Match Node”) will automatically bring the line-item onto the dimensionality of your node and the warning will no longer be shown.

Manage Filters

The “Manage Filters” dialog relates to filters set on the levels that affect the view onto the data of a line-item. The filters set here are permanent.

To set a filter on one of the levels in the line-item, click on the level first and then adjust the filters to your desired view. To set filters on a level, it must be in the dimensionality first.

JavaScript errors detected

Please note, these errors can depend on your browser setup.

If this problem persists, please contact our support.