
1. MDE Base Data and Dimensions
See the starting page Generic Model Tutorial for overview of this tutorial.
In this step, we look at the data required, create dimensions, and develop a model hierarchy.
Required Data
We start with evaluating our data and estimating what kind of drivers we want in our model. The highest level KPIs will look like this:
All models need data in order to work. This high-level data, such as needed for the tutorial, is available in most companies:
Total Revenue by Product & Country
Total Volume by Product & Country
Total COGS by Product & Country
A Personnel/Non-personnel cost split for each product
The total number of person-days as well as the daily rates per consulting services, staff group & country
This does not match the 1-to-1 that we need for our driver model. However, we can derive additional information from the total data. For example, the average price of the product can be calculated as revenue divided by volume.
Project Creation, Data Upload & Dimensions
To start off, we will create a new project and upload our data.
Before modeling and uploading the actual data, we need to create our dimensions. What dimension we use depends on the use case of the model. It is usually a trade-off between the number of dimensions and the number of nodes. In our case, we want to have the following dimensions:
Dimension | Content |
|---|---|
Staff Group | Division of employees into tariff groups |
Offerings | Classification of revenue streams and associated costs. The first level distinguishes whether it is a product or a service, the second level contains the product and service families. |
Location | Countries by Region. |
Creating Dimensions
Dimensions can be created via the dimension management.
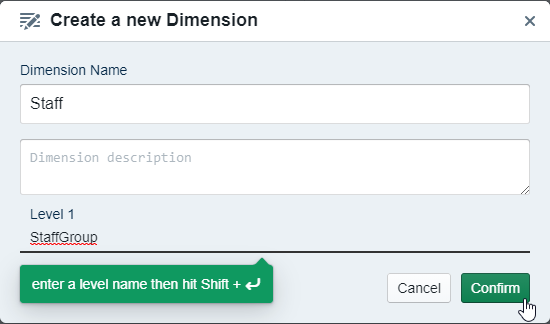
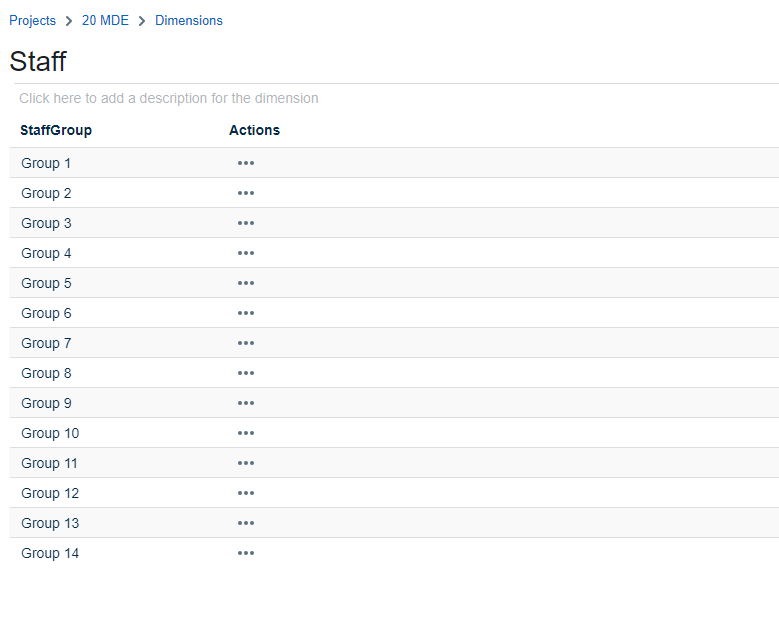
First of all, create a dimension called 'Staff' and call the Level 1 'StaffGroup'. Then upload Staff.xlsx to fill in all the different values.
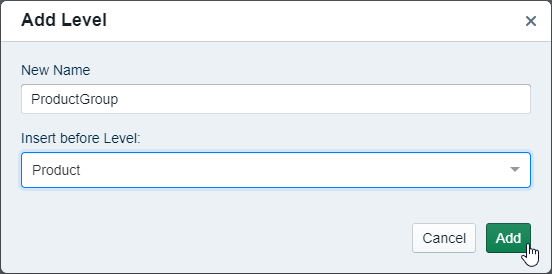
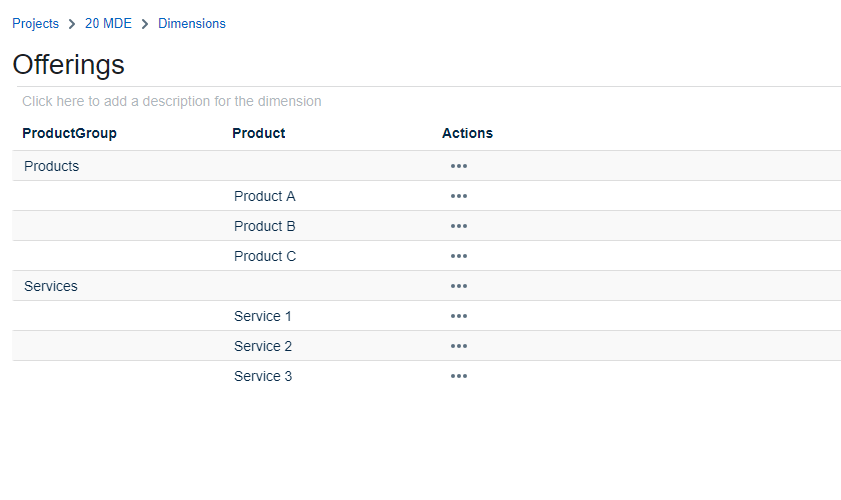
Next, create a dimension called 'Offerings' naming the Level 1 'Product'. Now add the level 'ProductGroup' above Product. Afterward, you can upload Offerings.xlsx.
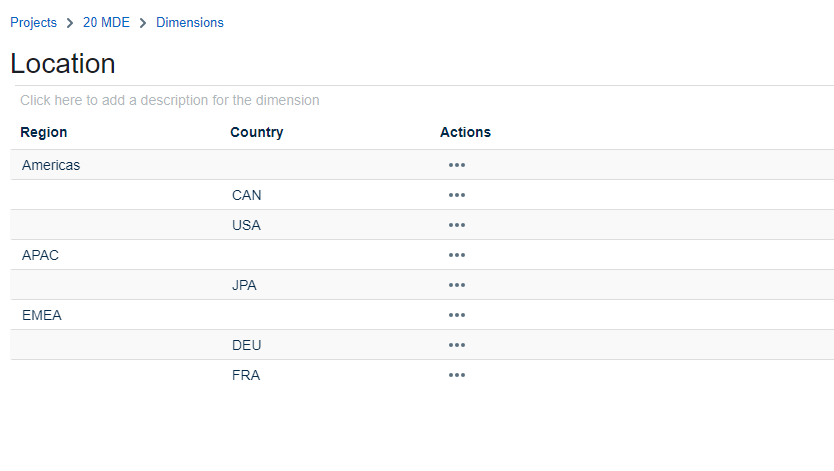
Now we can create the final dimension called 'Location' with a Level 1 called 'Country'. Add the level 'Region' above Country, as you did on the previous dimension. Upload Location.xlsx to finish this step.
The resulting dimensions should look as follows:
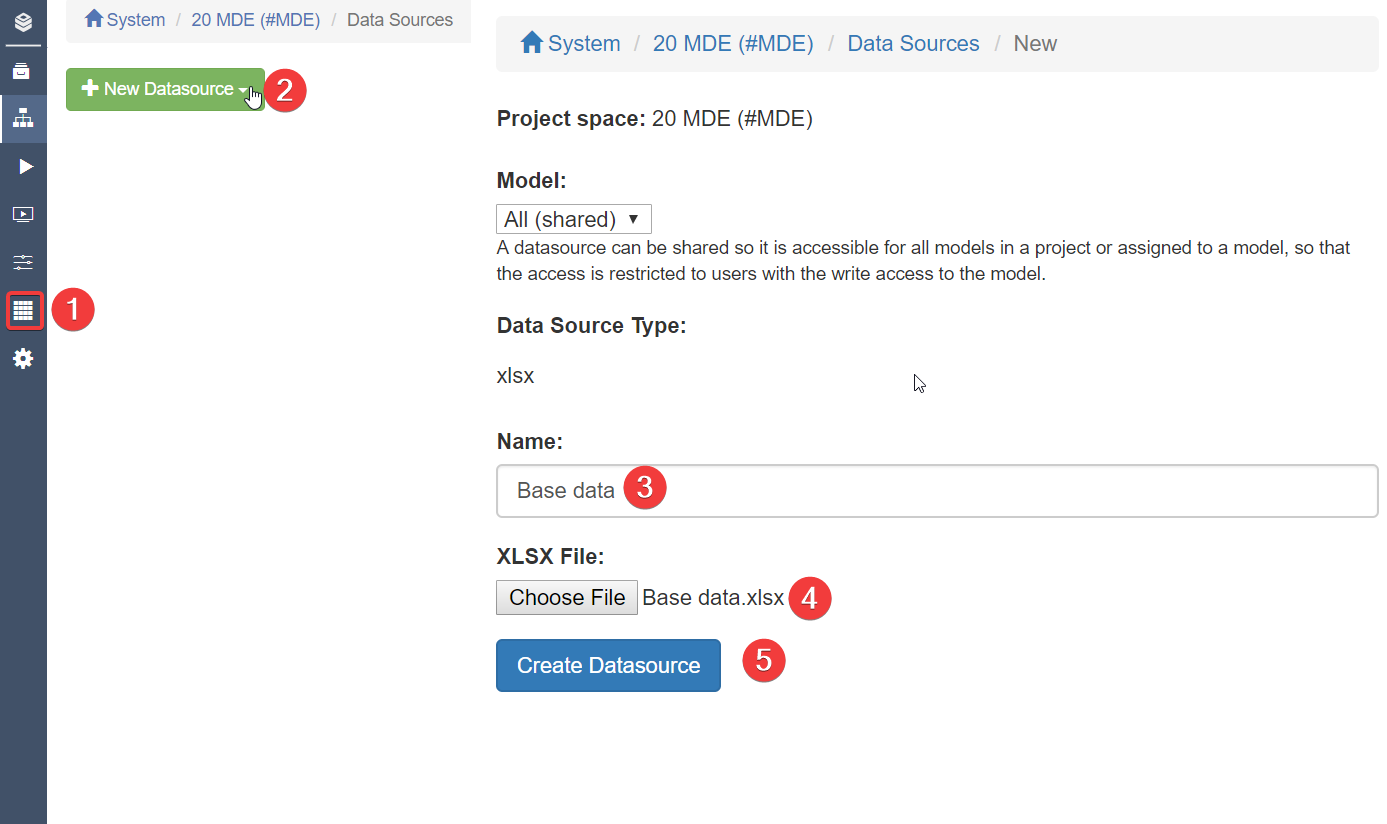
Uploading Base Data
We follow it by uploading the Base data.xlsx. Please remember to name the Datasource 'Base Data' as shown below.
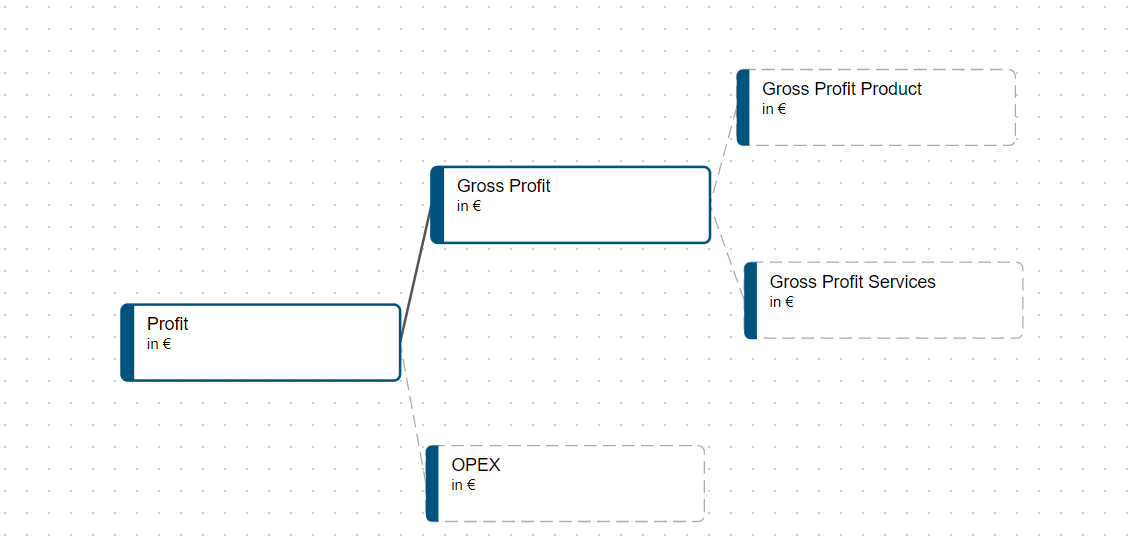
Defining the Model Hierarchy
Our main goal is to simulate the Profit & Loss (P&L) KPIs. However, putting everything into one single model would make the relationships nontransparent. Therefore, we create the following hierarchy:
To create such hierarchy, we create 6 empty models in Valsight:
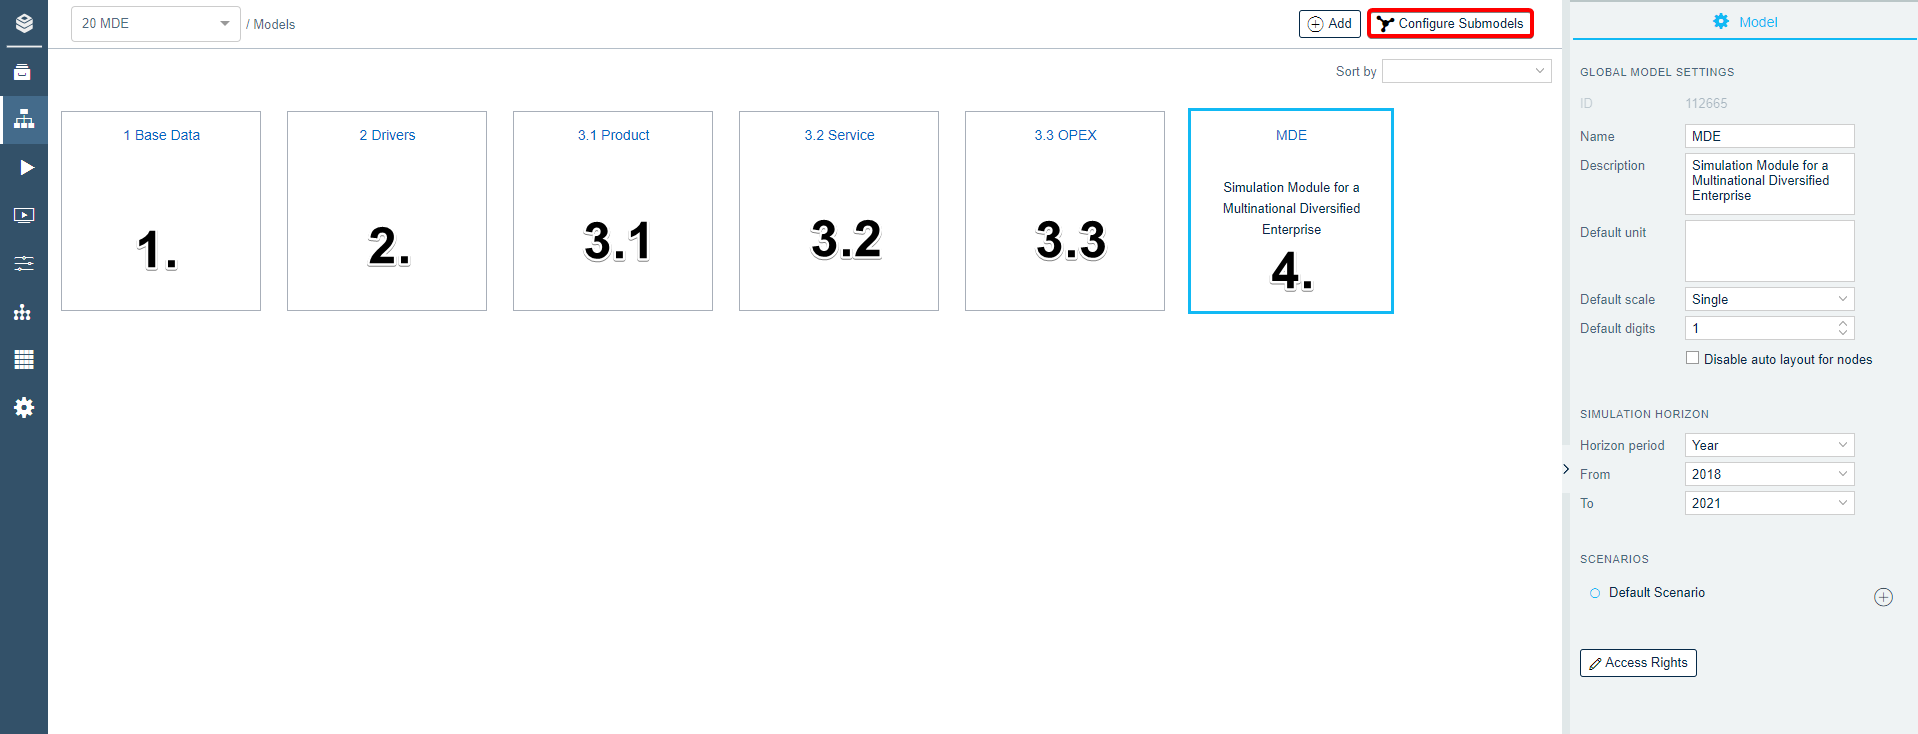
Linking Submodels
The linking of submodels (as explained in Working with Submodels) is done via the 'Configure Submodels' button which is highlighted in the previous picture.
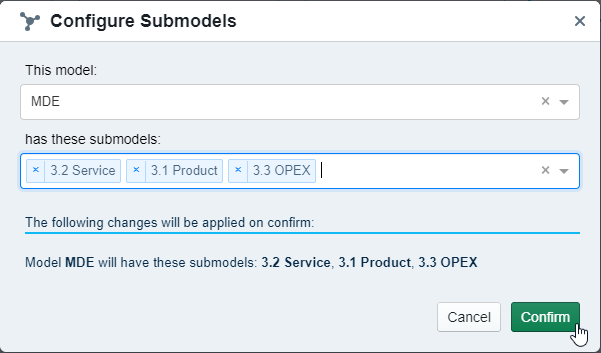
The following list explains which Submodels need to be linked:
Submodel | Linked Submodels |
|---|---|
| None |
|
|
3.1 Products |
|
3.2 Services |
|
3.3 OPEX |
|
| 3.1 Products, 3.2 Services, 3.3 OPEX |
Next Step
Congratulation on creating your first sub-model structure. Now go ahead and move to 2. MDE Submodels and fill it with data.