
Create First Nodes in the Model and Define Driver Logic
This page is part of a tutorial. If you have navigated to this page directly you may start the tutorial at https://documentation.valsight.com/documentation/v2-building-a-first-model-step-by-step.
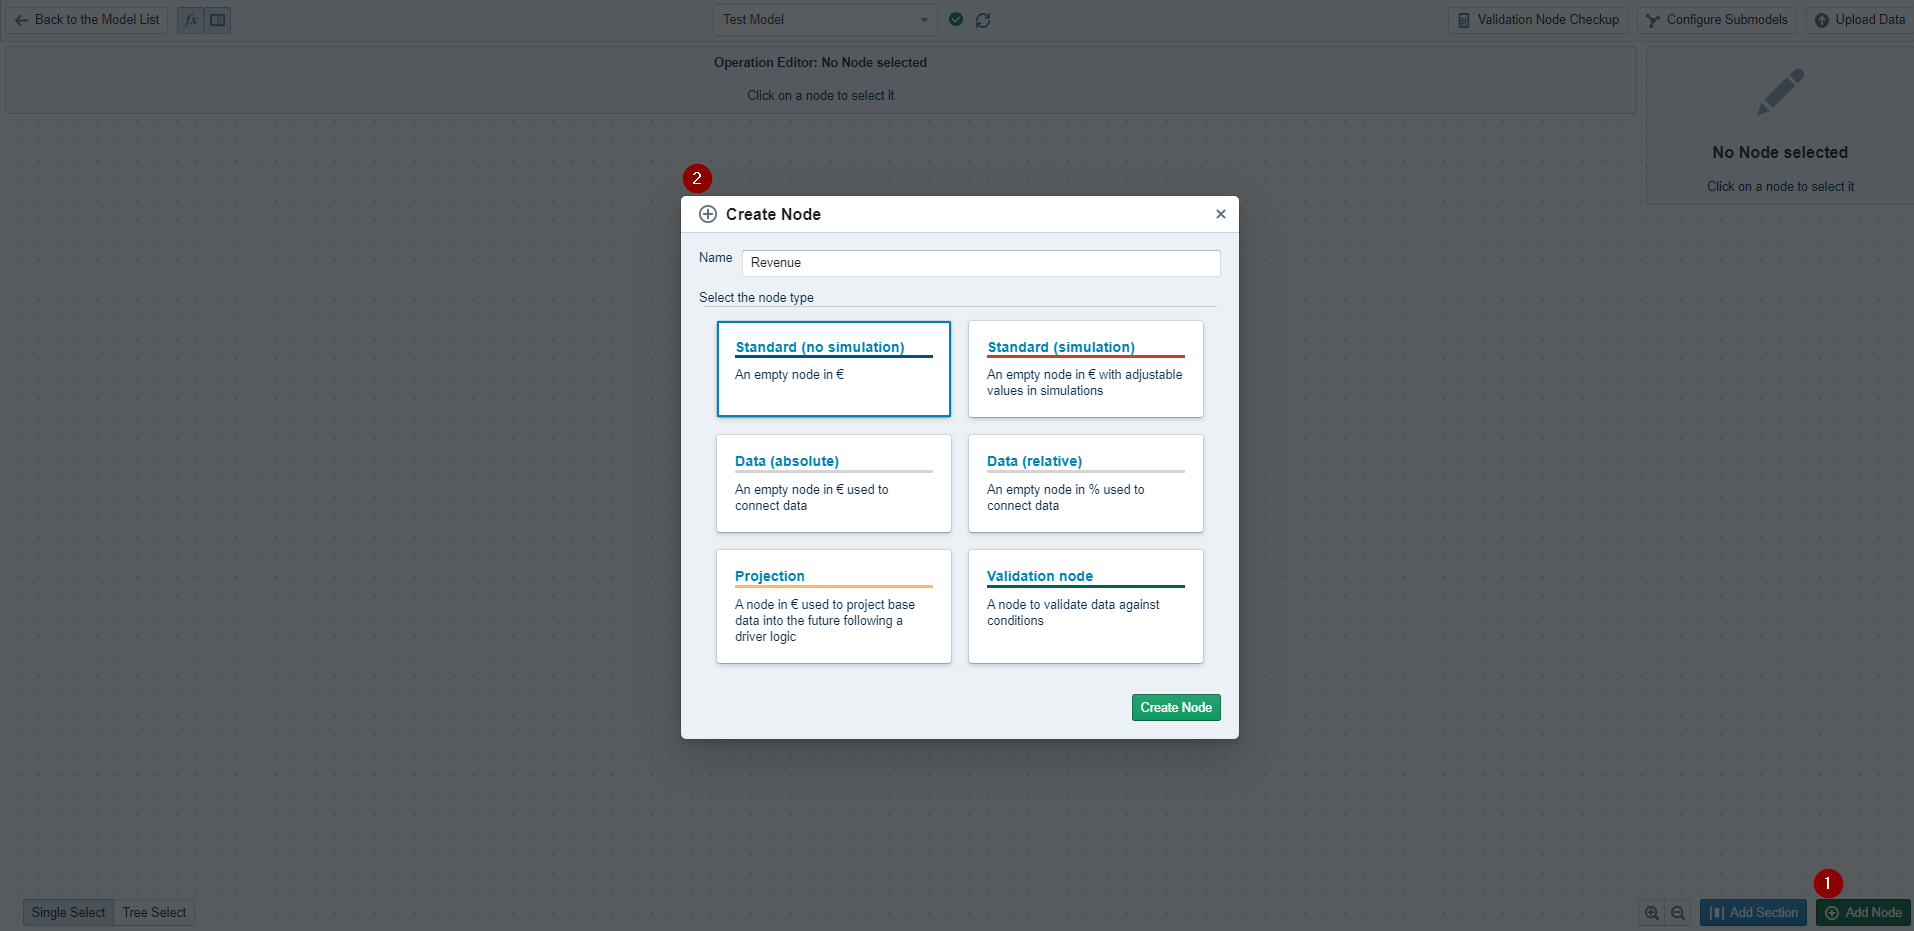
In this step, we will build the general structure of the model by adding "nodes". To keep things simple our first "node" will be named "Revenue"
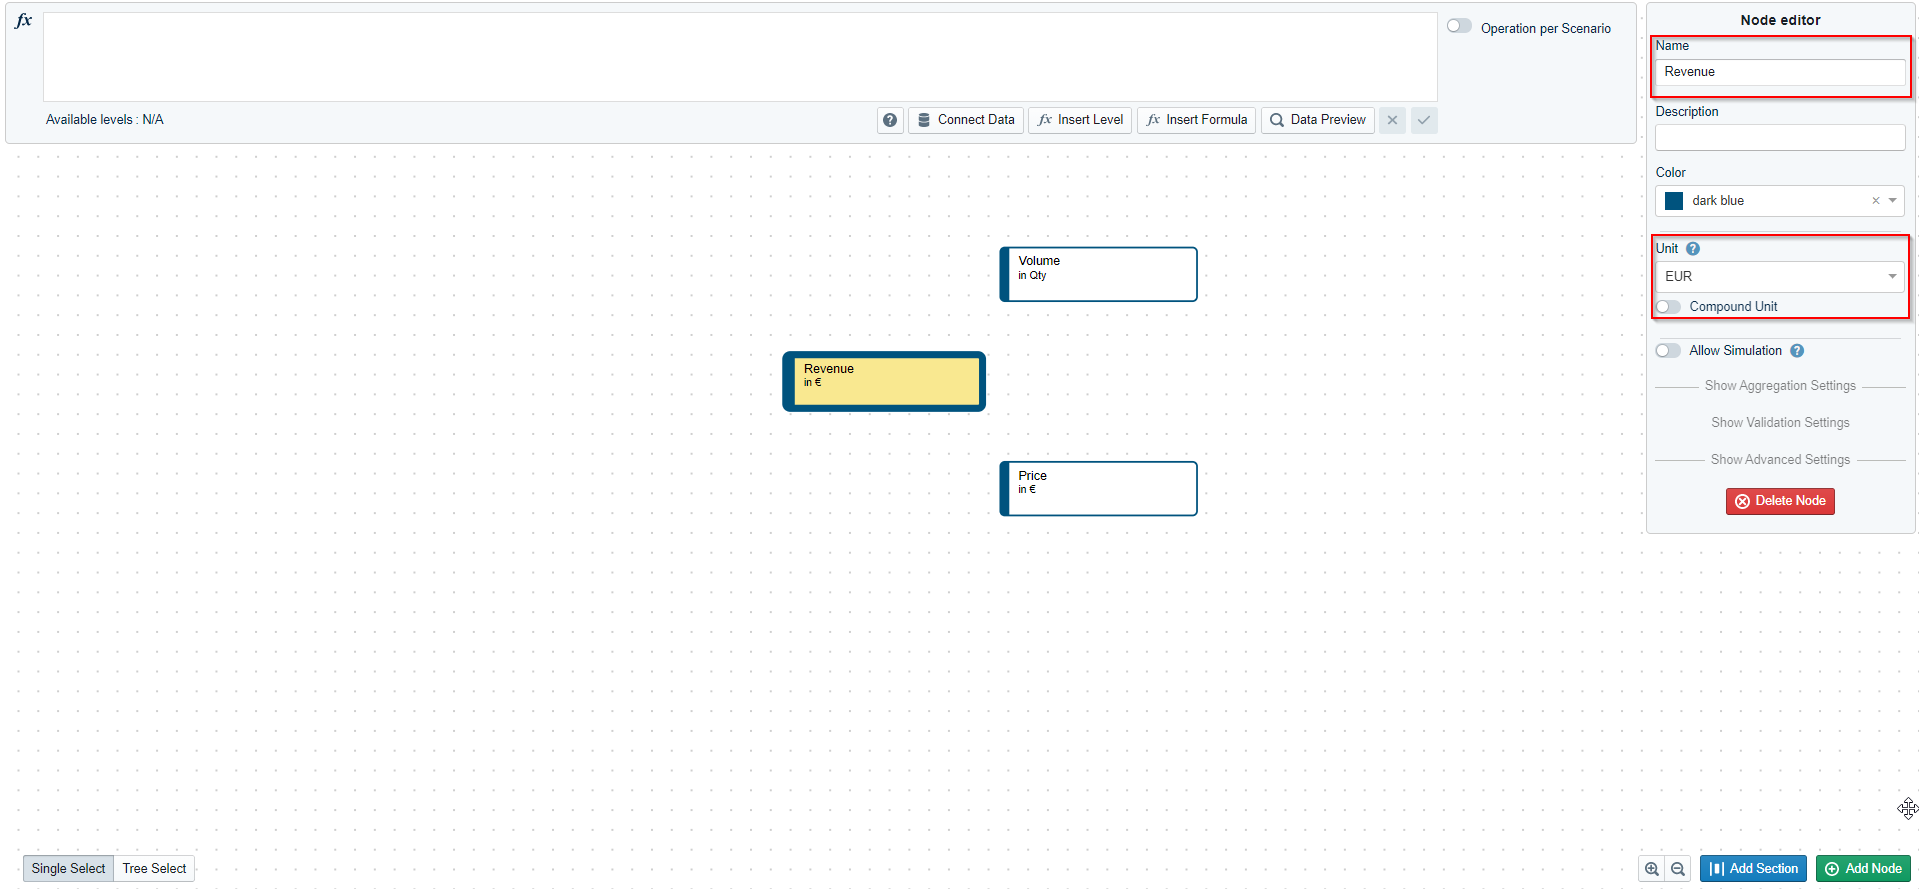
We will now add the nodes "Price" and "Volume" to the empty canvas.
When clicking on a node, the "Node editor" opens. Here we can enter the name of the node and make changes in its "Unit" section. The unit for each node is automatically set to EUR, because it was defined as the default unit of the model earlier. For the node "Volume" we will now change the unit to "Quantity".
We now have to connect our two new nodes ("Volume" and "Price") with the first node "Revenue". We therefore select "Revenue" and open the "operations function" in the upper left corner. Now we can type in our desired function (in this case: 'Volume' * 'Price' )
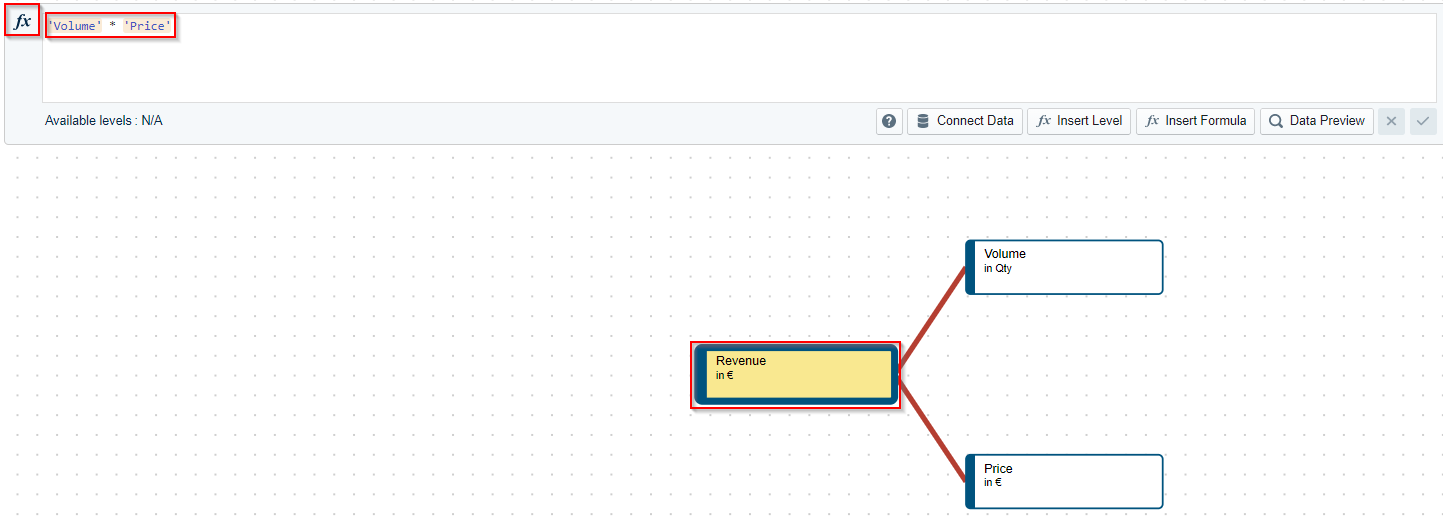
The Nodes referenced in the operation field always have to start and end with an apostrophe. If you enter an apostrophe and start typing the name of the required node, the software will also offer auto completion.
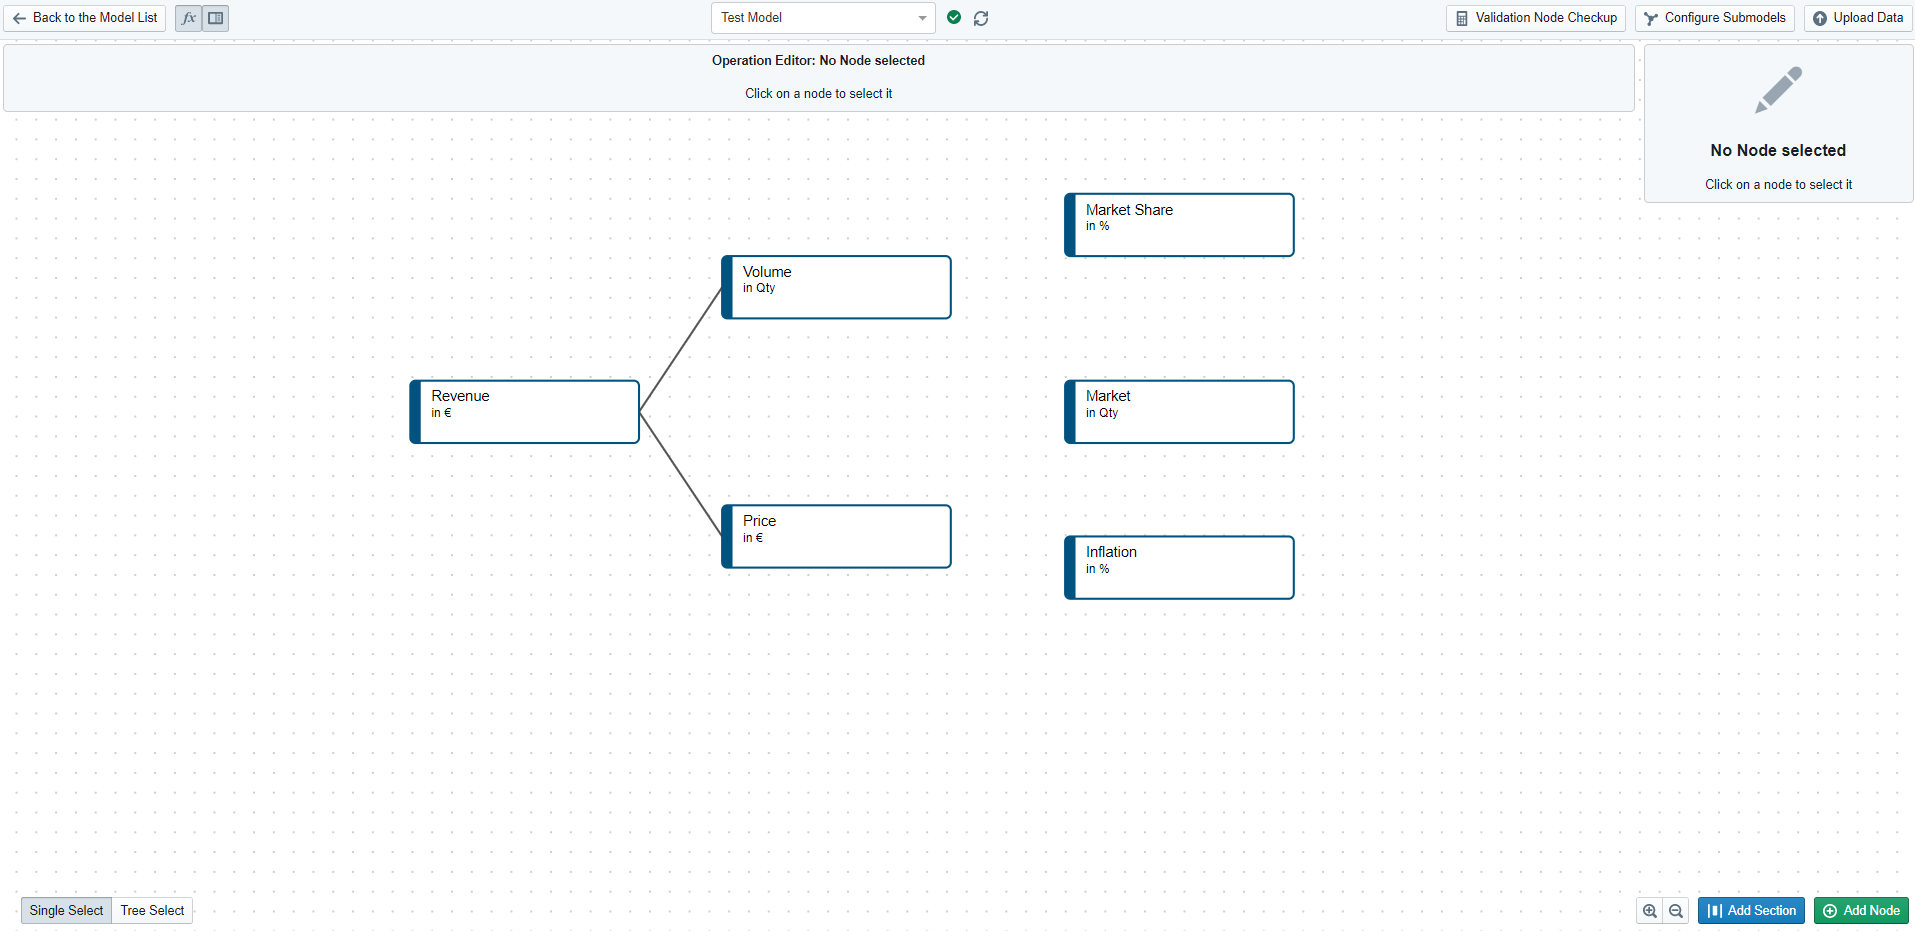
The model now contains the very basic structure for revenue. We are now going to integrate the drivers into the model and go through the necessary formulas to connect them.
We therefore add the drivers "Inflation", "Market" and "Market Share" to the model by once again selecting "add node". While doing this it is very important to set the correct units - Percent for Market Share and Inflation, Quantity for the Market.
As these last three nodes are supposed to reference external data, we first need to create and integrate the respective data tables, which we will do in the next step. As you may have realized, we haven't defined any formula for inflation, the market, and the market share yet. We will revisit this, after integrating the data, to be able to see the outcomes of the calculation immediately.