
Workspaces
Basic Overview
Workspaces are a fundamental part of Valsight and allow you to perform simulations. They are a sandbox in which you can create simulation scenarios and visualize the resulting data, as well as analyze and compare them, using tools such as charts and tables.
A simulation workspace is always based on an underlying model that structures the relevant data in nodes and defines their calculation logic.
Simulation scenarios are local to the simulation workspace and consist of a list of assumptions assigned to the scenario. These assumptions describe changes to the base data of the Model and can be individually activated or deactivated for a specific scenario.
Using scenarios and assumptions allows you to analyze different assumed situations and results, enabling valuable insights into the changing outcomes of complex business models.
Core Functions
Workspaces combine three core functions that enable a controlled and comprehensive analysis of simulations and generated data.
The core functions are:
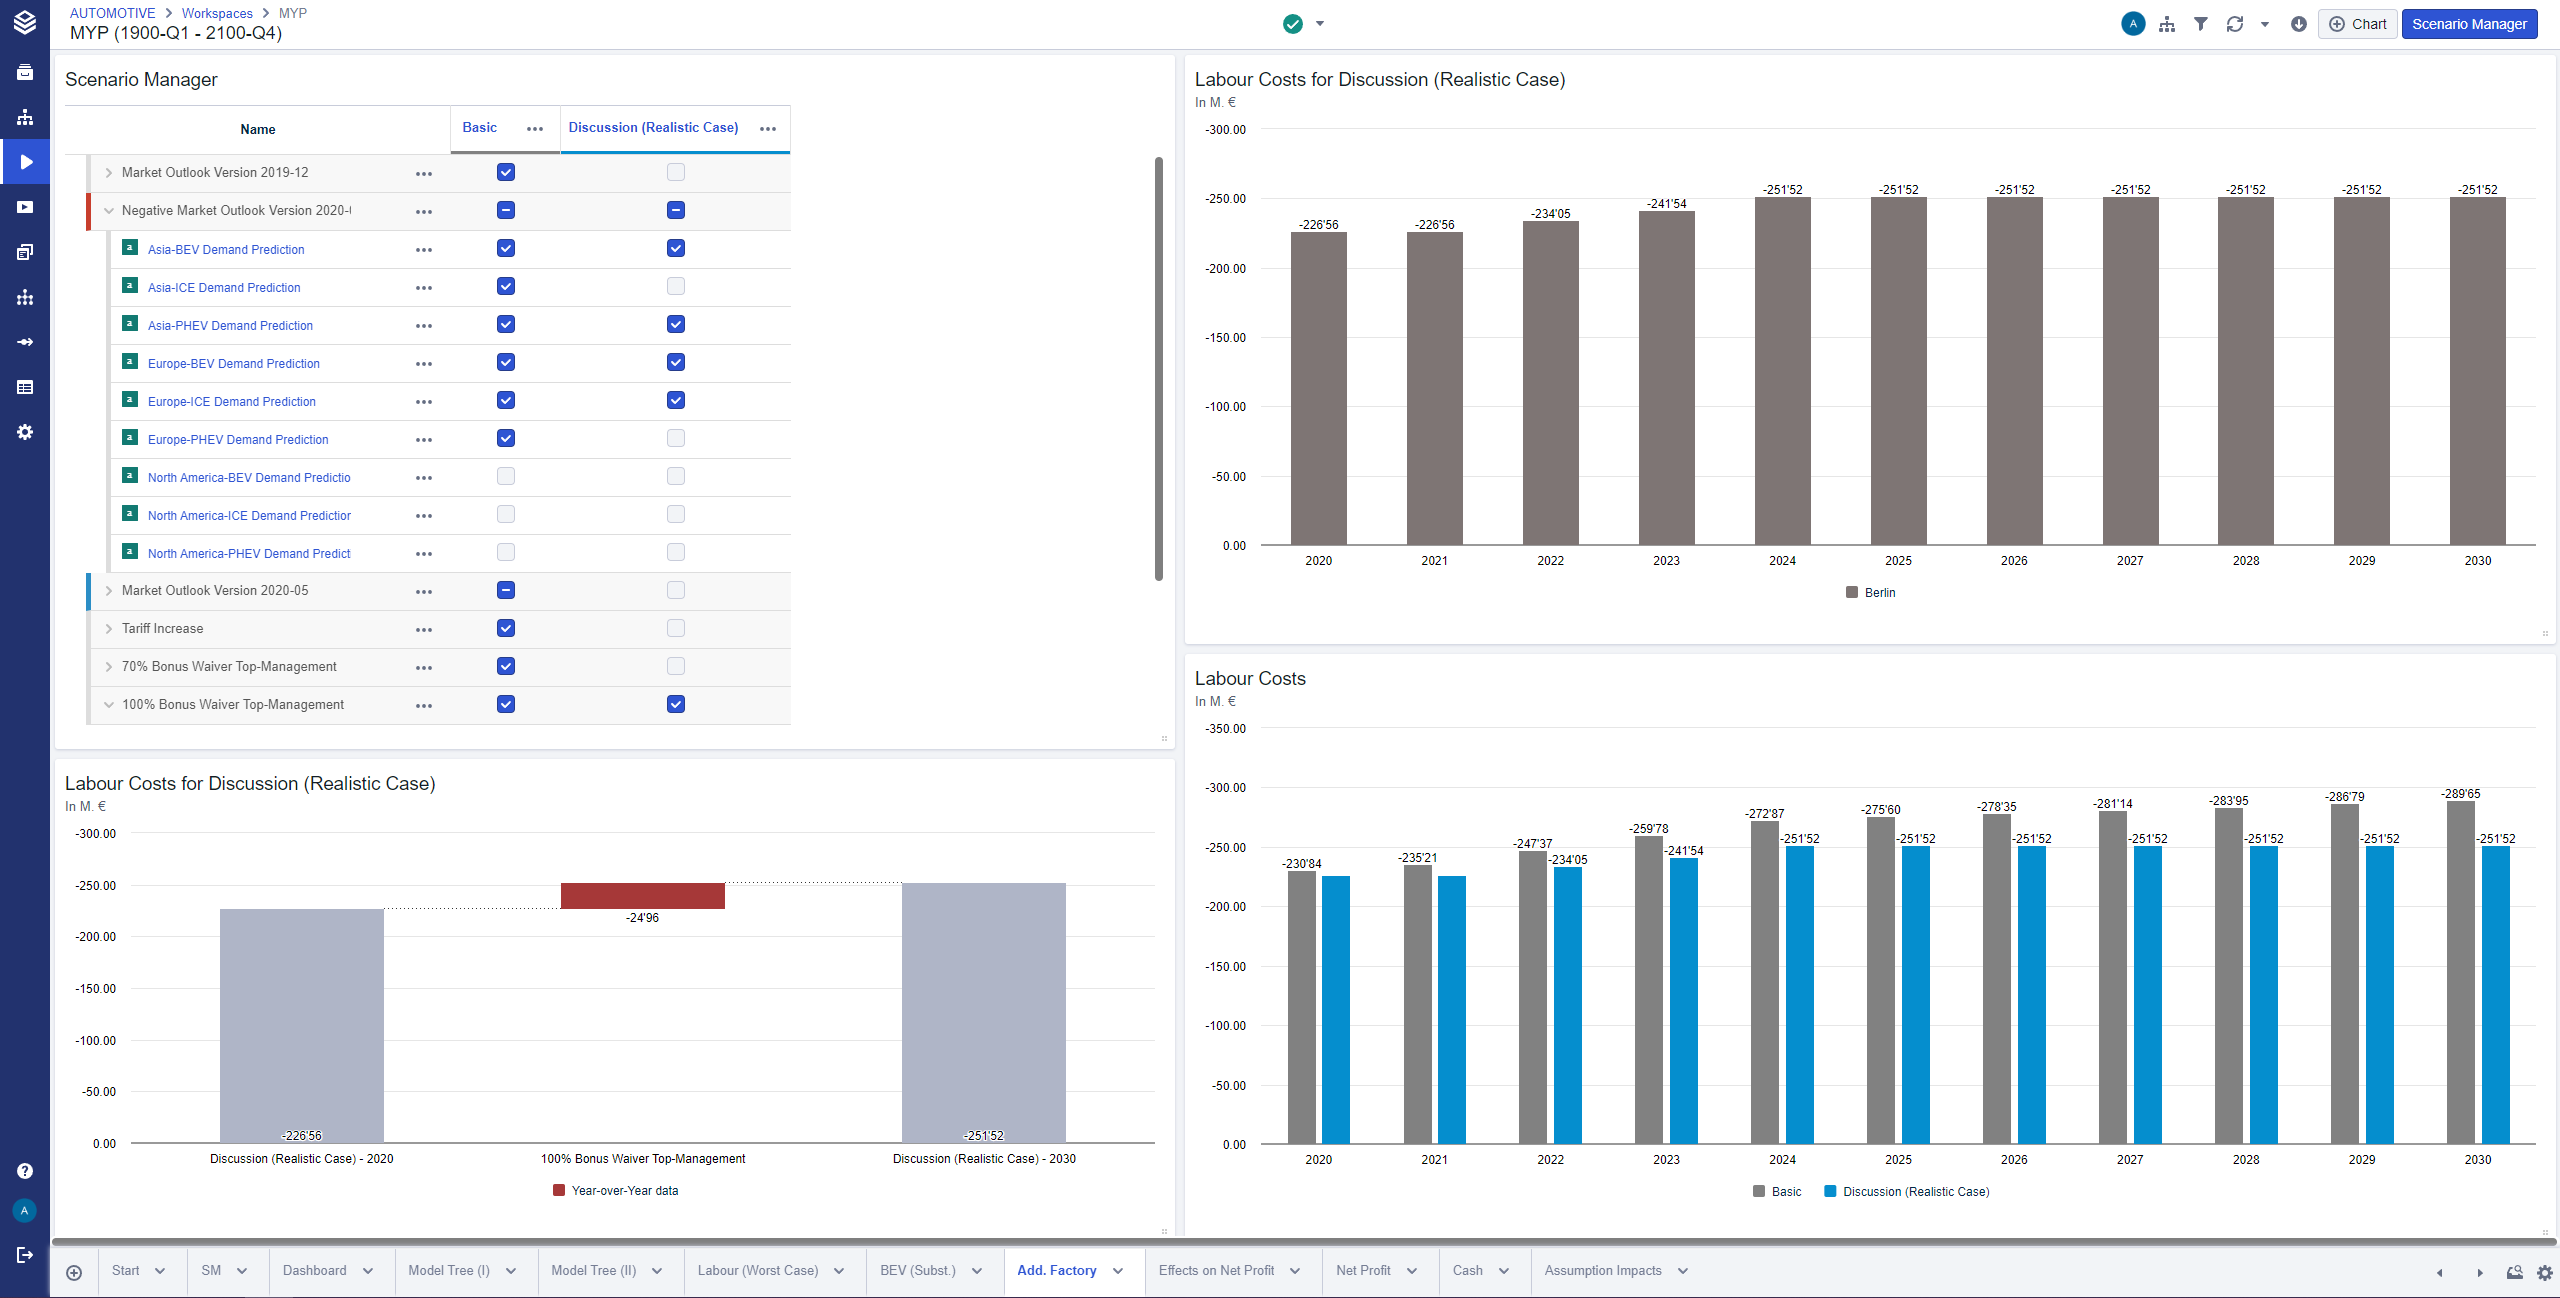
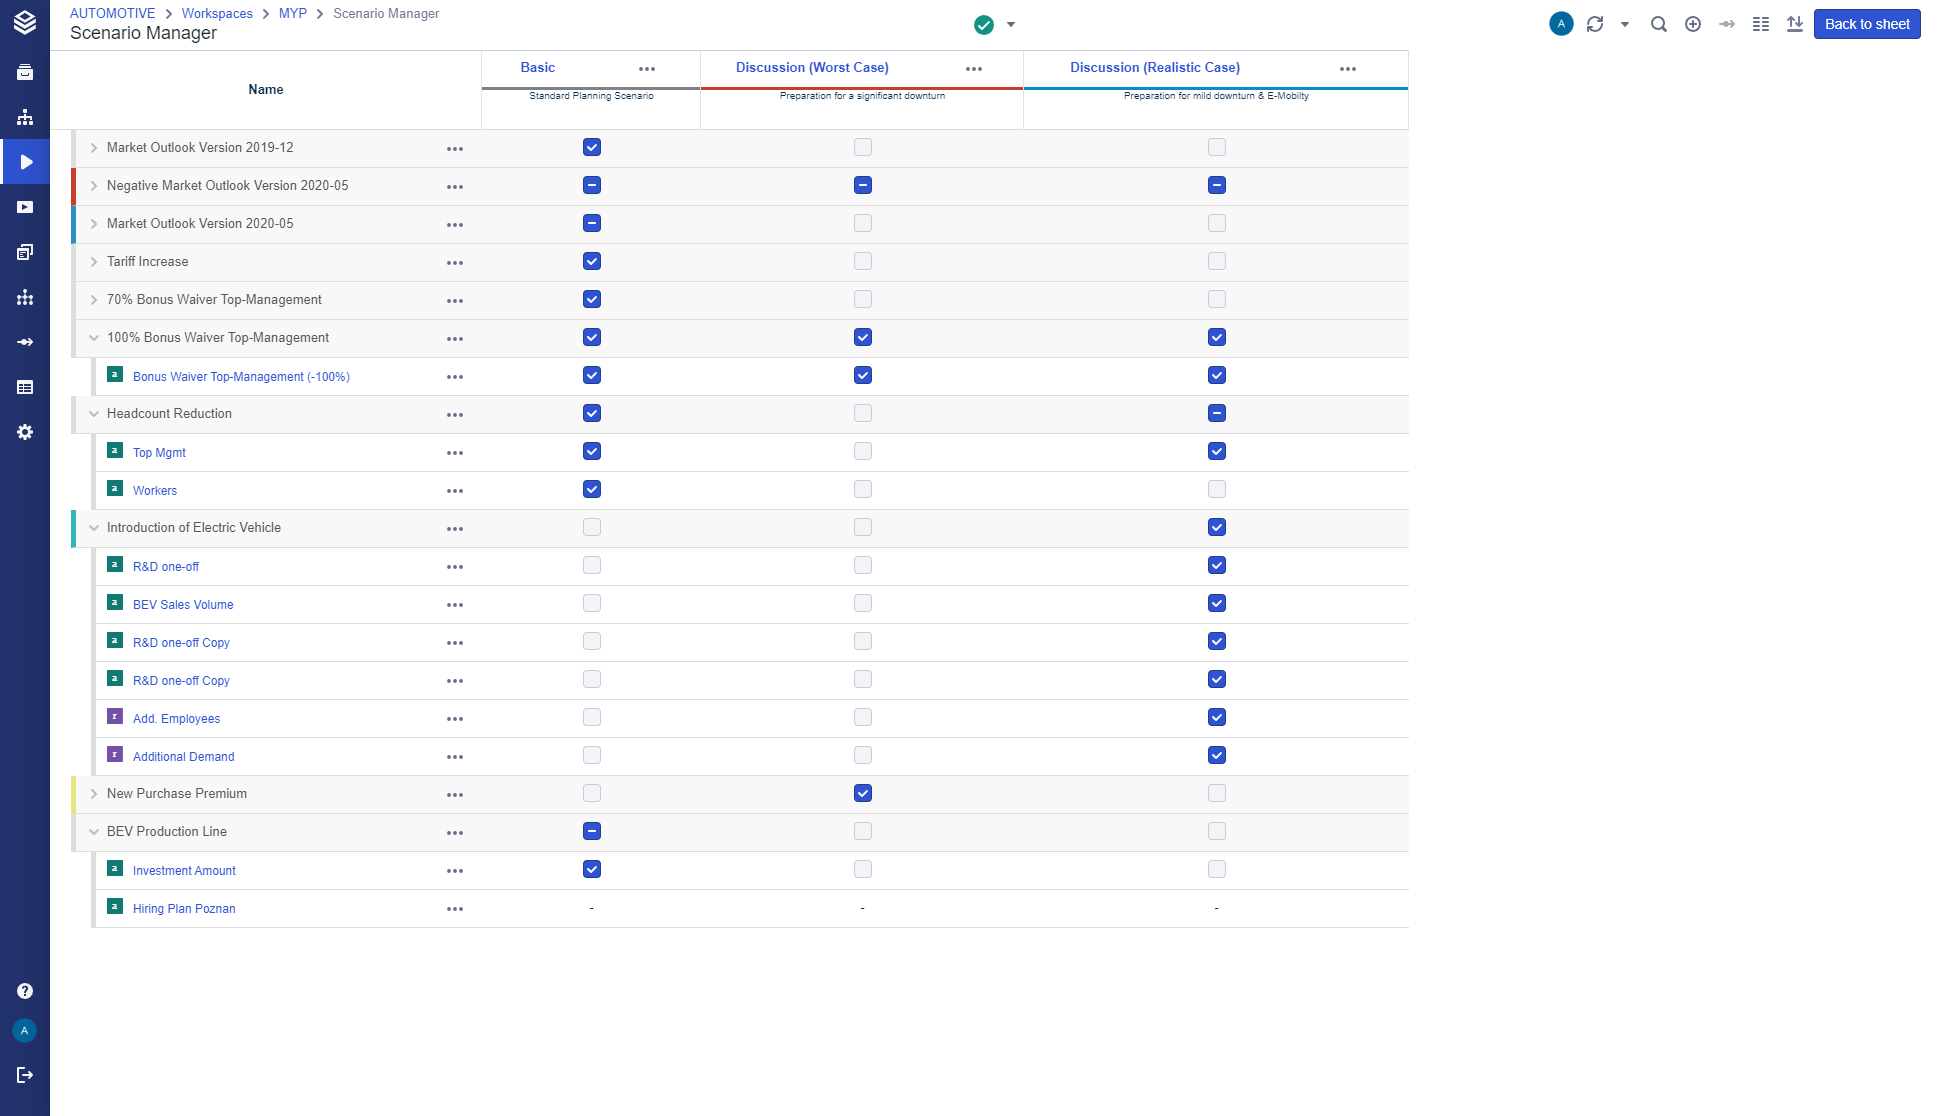
Scenario Manager: Contains an overview of all assumptions, line-items, and scenarios that change your base data
Worksheets: Allow you to dashboard graphs, tables, and other representations of your data
Charts: Display simulated data in a readable and comprehensive way.
Scenario Manager
The Scenario Manager can be used to create assumptions and line-items to simulate scenarios based on your driver model.
Scenarios represent different situations that are based on different sets of assumptions.
Assumptions are groups of line-items. They structure incremental changes to their baseline data into manageable groups of economic factors. Examples are "Base assumptions", containing line-items such as "Inflation" or "COGS", or "Market assumptions", containing line-items like "Change of Market Share" or "Change of Market Volume".
Line-items contain changes to the data of a single node and allow detailed changes in the data sets. They can be assigned to different assumptions to control precisely which changes to what data you want to examine.
Line-item data can either be adjusted based on adding or subtracting changes to the base data or be set to specific results for easier control. This can be done in the line-item data view. They can also contain different variants (Line-Item Variants), which are versions of the same line-item.
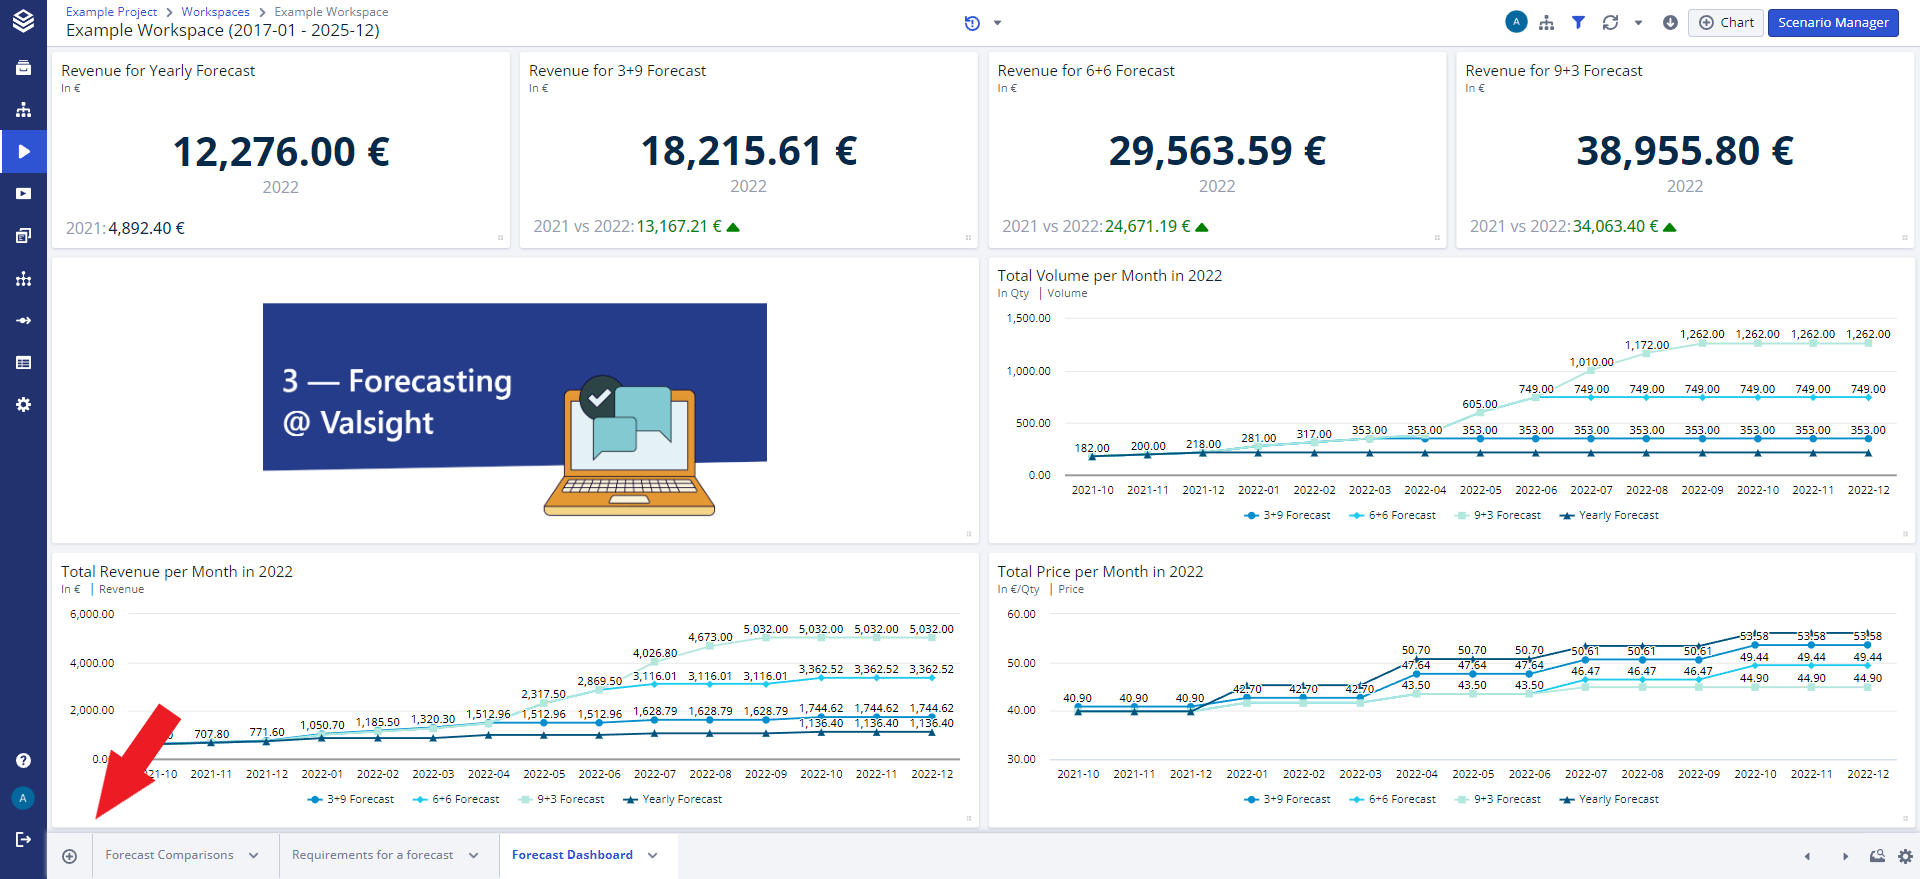
Worksheets
Worksheets display your charts and tables in tiles, to grant a dashboard overview.
You can create multiple worksheets based on the same scenarios and assumptions. Your worksheets are listed in the tab bar at the bottom of the page. Scrolling through the sheets can be done via the arrows in the tab bar.
Charts are configurable and can be changed in size and color to increase readability and control the manner information is visualized.
To provide a focus for a worksheet, worksheet filters can be used.
Worksheets can be created via the “+” button in the lower left corner of a worksheet.
Charts
Another core feature of a workspace is the creation of charts and tables.
Each chart has the functionality to be shown in a full screen mode via a button in the upper right corner, to simplify presentations or to highlight a certain chart.
Offered charts are:
Line charts display its data series as connected lines.
Column charts display data using vertical bars; multiple data series can be displayed next to each other.
Stacked column/bar chart displays its data using vertical bars and stacks the bars on top of each other if multiple data series are displayed.
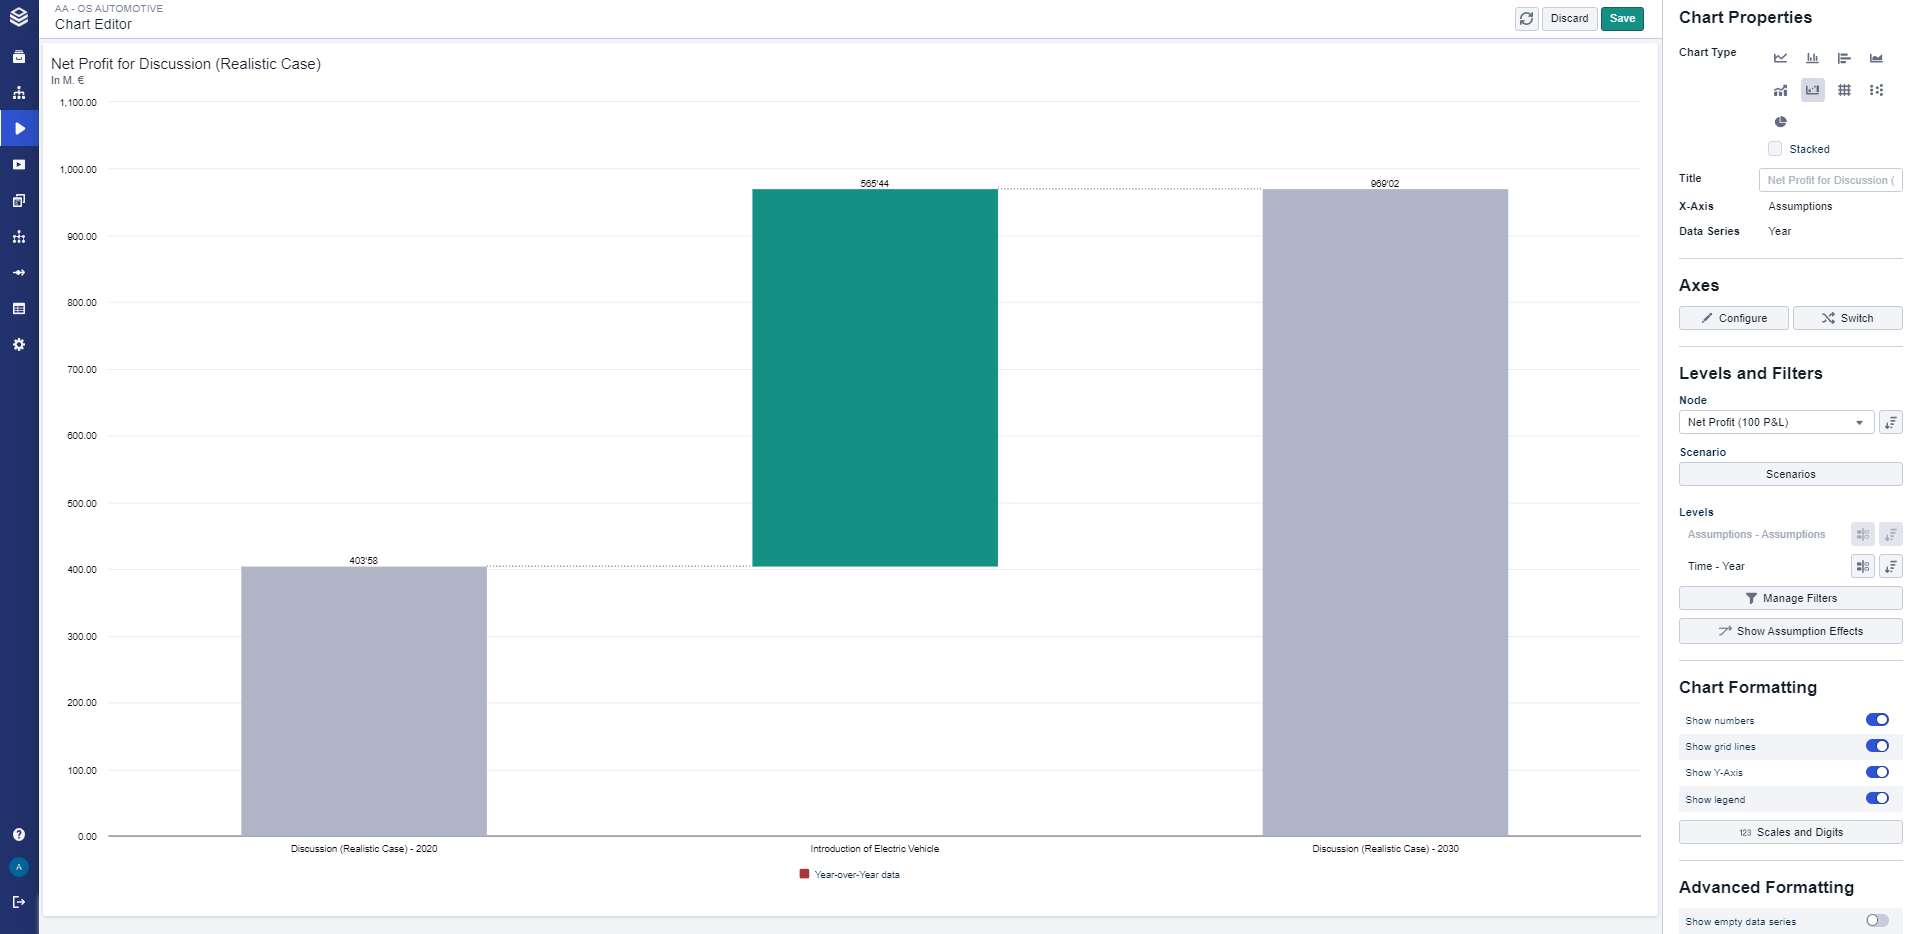
Scenario bridge/Bridge charts display the effect of active assumptions; you can show the effect of all assumptions or the effect of each line item inside the assumptions.
Area charts are extensions of the line chart with the area below a line being filled with color.
Further Reading: Chart Types and Data Visualization
Chart Editor
An important part of a chart is the editor. It grants you complete control over the configurations of any chart or table. Using the chart editor, you can configure the type of chart you want to use, on which node it should base, how the axes should be configured, and which levels and filters should be applied. Furthermore, there are additional formatting settings to configure the charts based on your needs.
By applying filters and adjusting the chart settings, you can control directly which data, factors, and calculations are represented in your graphs. It is also possible to format data points or series, to make their influence on the chart visible.
You can also add comparisons of specific data points to emphasize specific differences. Lastly, you can specifically adjust if the chart should contain grid lines, at what rate they should be displayed, and which limits the axes should adhere to.
The full-screen preview mode immediately shows you the impact of your changes while you configure your chart. To exit the preview mode, you can either save your changes or discard them.
Step-by-Step Approach
To create a simulation workspace, navigate to the list of workspaces by selecting "Simulating" in the navigation bar on the left. You will see a list of all simulation workspaces you have access to.
Click the round plus button in the top right corner, give your new workspace a name, and select the model and scenario to base the workspace on. The selected scenario defines the data baseline that will be used as the basis for all simulations you create in your new workspace.
After clicking "Create workspace", your new workspace will appear in the list of workspaces. Click on it once to select it, and you will see details in the chart editor on the right. You can change and adjust all of them, most importantly the simulation horizon (Changing the Time Horizon). This setting defines the time interval that will be used for all your simulations.
Open your workspace by clicking on its name. You will find it empty, without any charts or assumptions. You can continue by populating your workspace with new assumptions (Assumptions & Line-Items) , sheets, charts, and scenarios via the '+' button in the lower-left corner, or the Scenario Manager button in the upper right corner.