
Release Notes 3.9.0
These are the changes introduced with version 3.9.0.
Show data effects from the model in bridges
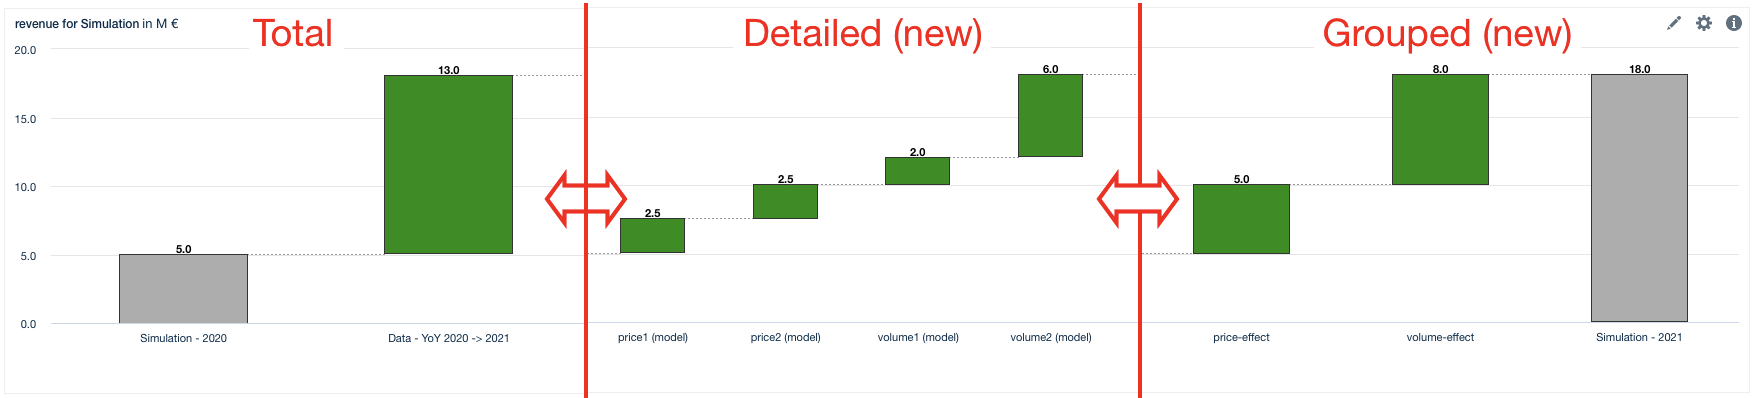
Changes from data in your model show up in a bridge by default as one "Data YoY 2020 → 2021" block (in the image below "Total").
Now it is also possible to show the effects split up into the nodes that caused them (in the image below "Detailed (new)") or grouped together as custom effects (in the image below "Grouped (new)"). Read Data Effects Display in Bridge on how to set it up.
Colors for sheets
Change the colors of your sheets to spice up your presentation or group sheets together.
Additional colors can be added per project in the configuration (see Editing the color palette).
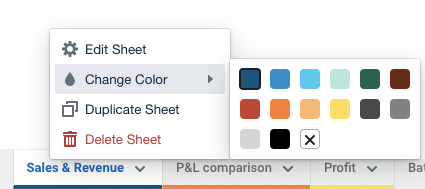
Renaming also got easier. Double-click on the sheet to rename.
Search in Dimension Management
There is a typo in a level value but your dimension is too big? Use the search to find the value easy and fast.
New functions
Safe multiply and divide
Multiplying two cubes with different level values will return only the level values both of them have in common. To make sure that this is not happening by accident use the Validation option of the new MULTIPLY and DIVIDE functions.
The node will fail if the rows do not correspond.
Multiplicative rollforward
The new function ROLLFORWARD_MUL will multiply all influences before applying them to the original node (unlike the regular ROLLFORWARD which sums them up before applying).
Lookup
Lookup values in different tables with the LOOKUP function.
More
- The scenario export in the workspace now runs asynchronous and provides a page to check the status of the export.
- Improved validations on upload of assumptions or line items.
- The SHIFT function can now be used on any level (prior it was only the time and sequence dimensions).