
Release Notes 6.14.0
Version 6.14.0 delivers major performance optimizations and new modelling capabilities that enhance both speed and flexibility. This release introduces improvements for large tables, new data functions, and enhanced chart interactivity—helping teams work more efficiently across complex models.
Modeling Improvements
Performance Optimizations for Large Tables
New Function: FILL_NA for Structurally Complete Series
Multi-Column Sorting in Table Charts
Modeling Improvements
Working with complex models is now faster and more intuitive thanks to several usability and navigation improvements in the Model Editor. You can now connect nodes directly by dragging from the colored border on the left side of a node—making it easier to build and adjust model structures. A new “Fit to Screen” button lets you instantly center and resize the entire model within your viewport. In addition, a mini-map provides an overview of your full model, helping you navigate large driver trees effortlessly. The mini-map can be toggled on or off at any time, depending on your preference.
Performance Optimizations for Large Tables
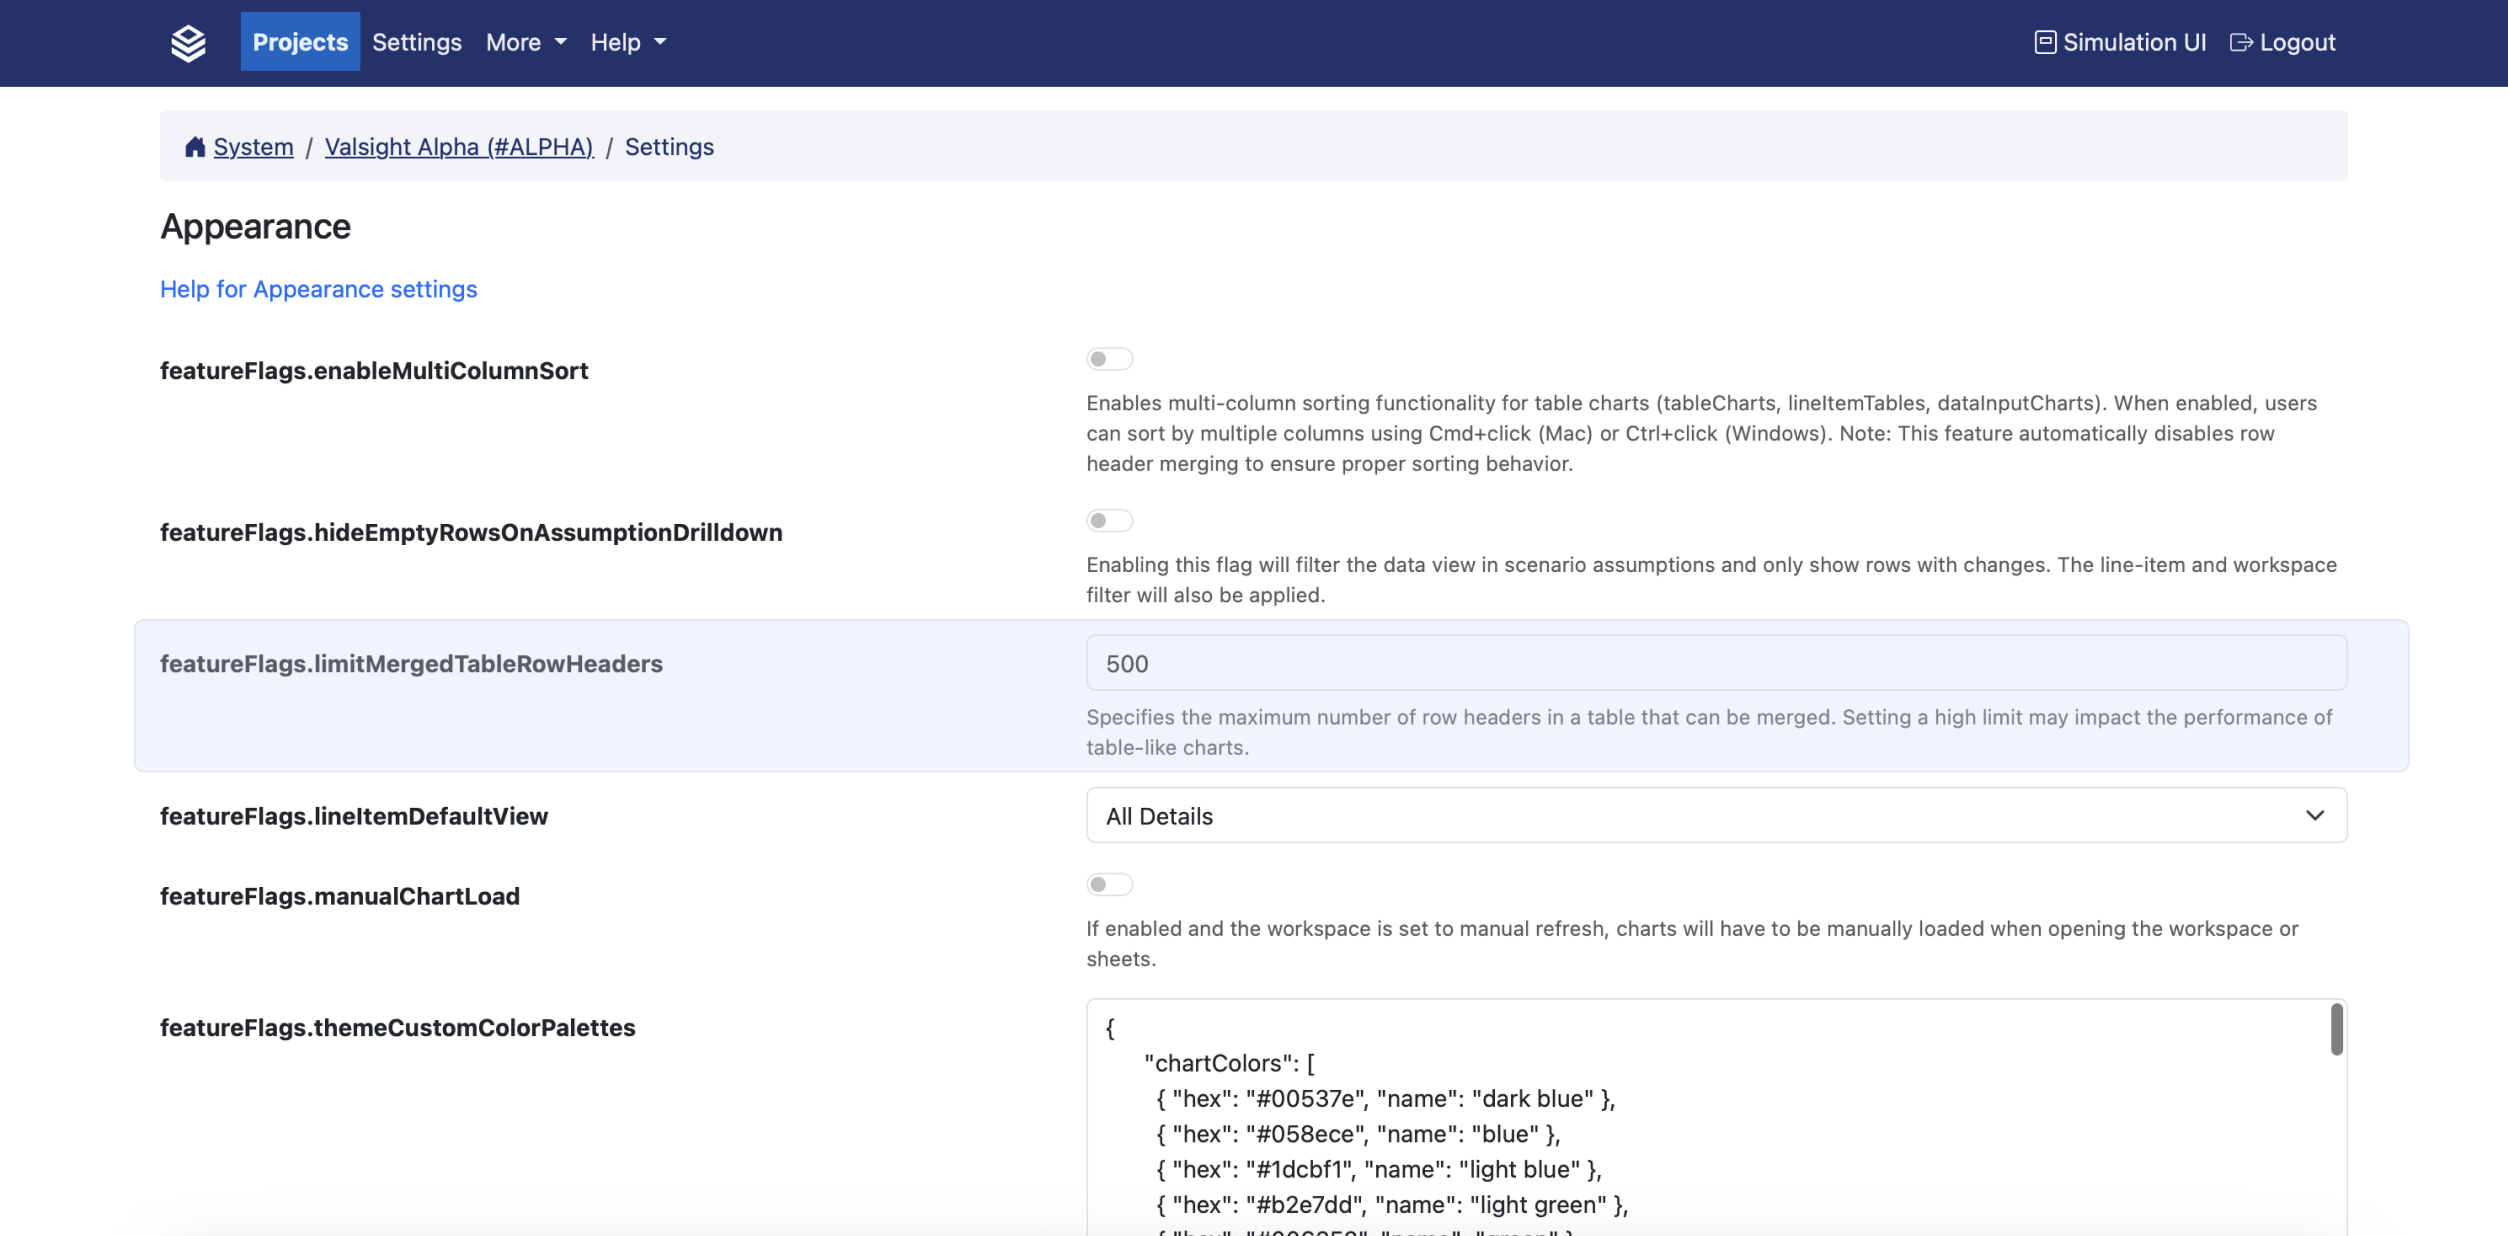
Table rendering has been enhanced with a new setting that disables merged cells when the number of rows exceeds a configurable threshold (default: 200). This significantly improves performance in large tables—especially when switching tabs or loading dashboards with high data volumes. The setting is applied at the project level, affecting all charts within the project.
For example:
A table with 199 rows will display merged rows as usual.
A table with over 200 rows will render without merged rows for better responsiveness.
PROJECT ADMINS ONLY Project Admins can adjust this setting under: Settings > Project Settings > Appearance > featureFlags.limitMergedTableRowHeaders
New Function: FILL_NA
The new FILL_NA function ensures that each combination of dimensions contains a complete set of values for a selected level—such as every month for each product. Missing cells within a series are filled with a specified default value, making datasets structurally complete without artificially adding missing rows. This enables more consistent calculations and charting across time and other dimensions.
For more information, visit our documentation.
Multi-Column Sorting in Table Charts
You can now sort by multiple columns in table charts, data input tables, and line-item tables. This allows for easier exploration and clearer insights—especially in wide or deeply structured tables. Sorting is non-persistent and resets when the view is refreshed or resized. To ensure optimal performance, merged cells are automatically disabled while sorting is active.
This option can be activated in the admin UI under Project Settings > Appearance > featureFlags.enableMultiColumnSort.
To sort by a column, simply click on its header. To sort by additional columns, hold Control (or Command on Mac) and click the headers of the other columns you want to include.
Other Improvements
Configurable Suspicious Input Scanner
A new instance-wide security feature allows administrators to scan and block suspicious input patterns (e.g., scripts or SQL injections). Modes include OFF, LOG, and PREVENT. Default patterns can be customized via system configuration, under Settings > Security > featureFlags.suspiciousInputScanner.blacklistPatternsModeling Performance Enhancements
Improved internal calculation logic and reduced overhead when validating model structure—resulting in faster model validation, especially in large models.
For detailed information on these features and more, visit our documentation.
Happy Simulating!