
Release Notes 6.3.0
Version 6.3.0 is a major update! If this is your first update since 6.0.0, be sure to check out the previous release notes for versions 6.2.0 and 6.1.0. Since 6.0.0, we brought significant enhancements, including pivoting tables in line items for faster and more flexible data input, a new Export Manager, and the ability to share exports across projects. 6.3.0 introduces further improvements to charts, data sources, the interface, and new formulas.
Key highlights of this release include:
Faster Creation of Line Items: Streamline your workflow with improved line item creation.
Export Manager Enhancements: New features for sharing and importing exports.
New Function - Levelfilter: A powerful new function to refine your data.
Filter Synchronization: Keep your filters in sync across different views.
Improved Stack Charts & Multi-Select: Better visualization and selection options.
UI Improvements: Enjoy a more user-friendly experience with our latest interface updates.
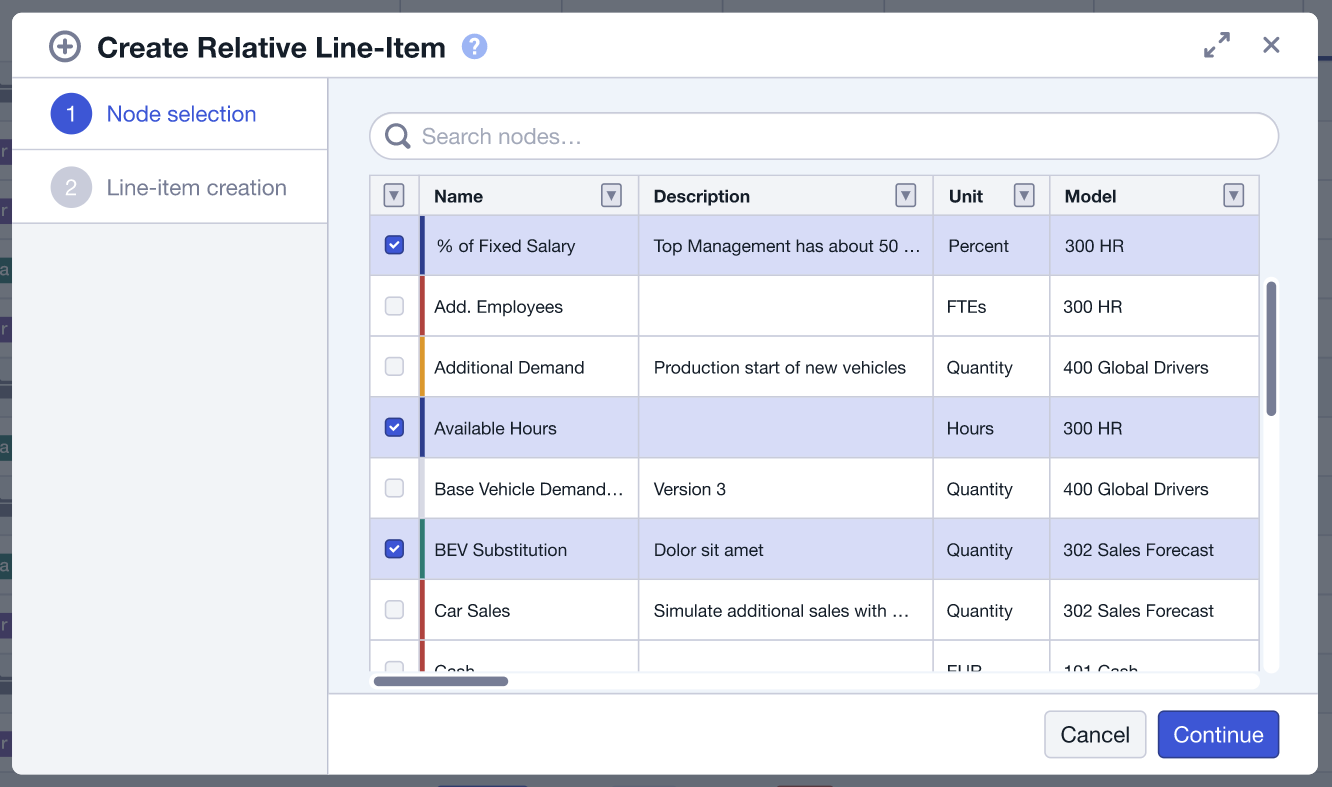
Faster and Easier Line Item Creation
With our latest update, you can create all your line items for an assumption in one step. Simply select all the nodes for which you wish to create line items and adjust them to your liking. You can now create both absolute and relative line items in a single step. Additionally, we've moved the button to create line items outside of the settings menu, for an even faster execution.
For more details, check out the full documentation here.
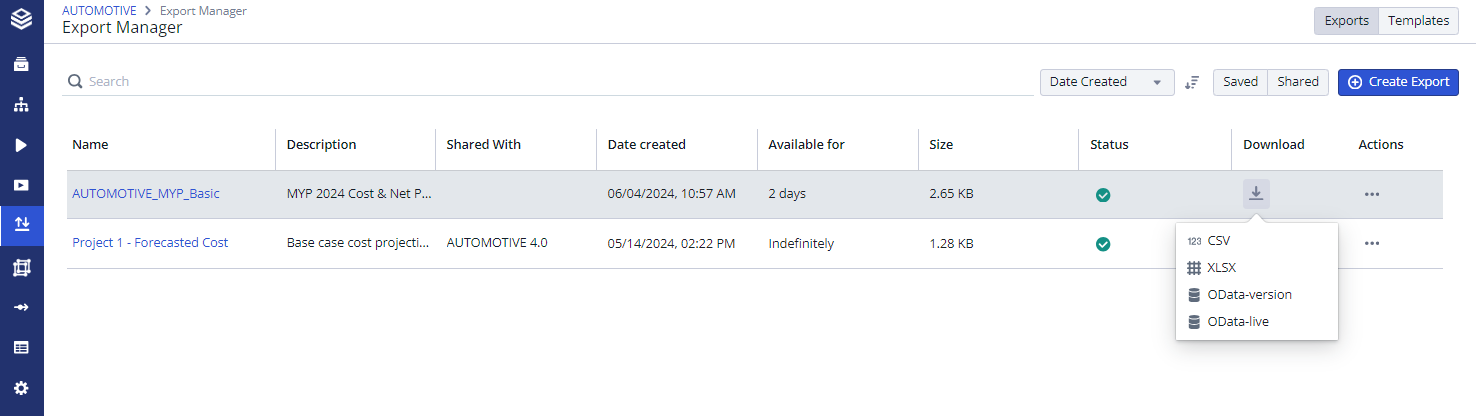
Additions to the Export Manager and Data Source Import
Our Export Manager has been enhanced with several new features to make your exporting flow smoother. You can now save exports indefinitely, ensuring that a version is never lost. By keeping it in Valsight, you can also create new versions of this export at any time.
Downloading exports is now faster, thanks to new callouts and buttons that save you a click or two. Additionally, new quick filters allow you to navigate between your exports more quickly and manage them more effectively.
We have also introduced two new OData link formats: OData-live, which provides a live connection between the Valsight scenario and the OData link, and OData-version, which updates the OData link to the latest version of the export, providing more control and flexibility.
For more details, check out the full documentation here.
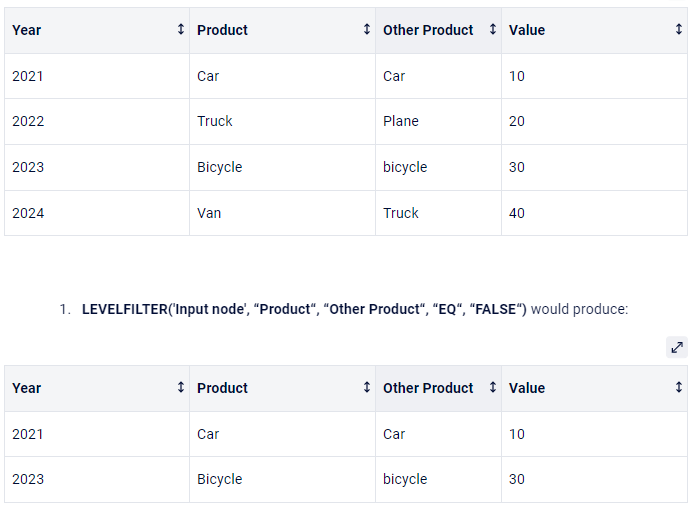
A new Function: Levelfilter
Introducing the Levelfilter function! This new feature allows you to filter a node to return only the rows where two or more levels meet a specific requirement, such as being equal (EQ) or different (NEQ) from each other. This function is incredibly handy for refining your data and gaining deeper insights.
Explore this and all other node formulas here.
Synchronized Filters Throughout Input and Preview
We are now saving and synchronizing your filters across data input and other views. This ensures that your input and preview pages remain consistently filtered, providing a seamless and cohesive experience.
For more details, check out the full documentation here.
Other Improvements
New Additions to Ease Compliance of GDPR Requirements:
Get a list of all personal data
Automatic deletion of personal data
Export scenarios including all assumptions and variables
Download all models, data sources and dimensions as a zip file
Video Tutorials: Check out our brand new tutorial videos for various topics ranging from setting up a project, using filters correctly or building scenario bridges. More videos coming soon! (German only for now).
Node Editor: The advanced settings for nodes in the node editor are now easier to see, enhancing visibility and usability.
Multi-Select: We have introduced a checkbox interface in every dialogue where selecting multiple items is possible. This addition makes it clearer and more intuitive to select multiple options.
Stacked Chart: Zeros and nulls in the datasets are now visualized more cleanly across the stacked chart, eliminating breaks that appeared when there was a zero.
Visibility of Chart Settings: It is now easier to see that charts are set on "Assumptions - Line Items,"
Check out our new ‘Technical Release Notes’ for a summary of all relevant technical and administrative changes.
As always, visit our documentation for a more detailed description on how to use the new features.
Happy Simulating!