
Structure Driver Models
Outcome
This guide shows you how to structure a Valsight model so that it stays understandable, scalable, and easy to maintain as it grows. By the end, your model will follow a clear flow from raw data to high-level KPIs, using submodels to separate concerns.
Visual Layout
Driver models are structured from right to left, meaning that submodels and nodes should start at the right of the canvas and end on the left. Raw data and inputs appear on the right; final KPIs appear on the left.
Core Principles
Define your target outputs first
Identify a small set of key metrics and KPIs you ultimately want to analyze, such as'Revenue','EBIT','Headcount','Capacity Utilization'. These outputs define the “head” of your model and should be placed on the left side of your canvas.Work backwards to inputs and drivers
For each KPI, determine which intermediate calculations are required and which input data or assumptions are needed to calculate them. This backward approach prevents unnecessary logic and unused data.Keep each node focused and interpretable
Design nodes so that each one answers a single, clear question. For example, calculate'Unit Price'and'Units Sold'separately, then derive'Revenue'from them. Avoid combining multiple steps into one complex node.Define and apply dimensions consistently
Decide early which dimensions are global across the model (for example, "Time", "Region", "Product", "Business Unit"). Apply them consistently and avoid adding niche dimensions that only apply to isolated nodes.Separate layers using submodels
Organize the model into submodels that reflect a logical flow from data to KPIs. Use numeric prefixes and descriptive names to make the order and purpose explicit.
Recommended Submodel Structure
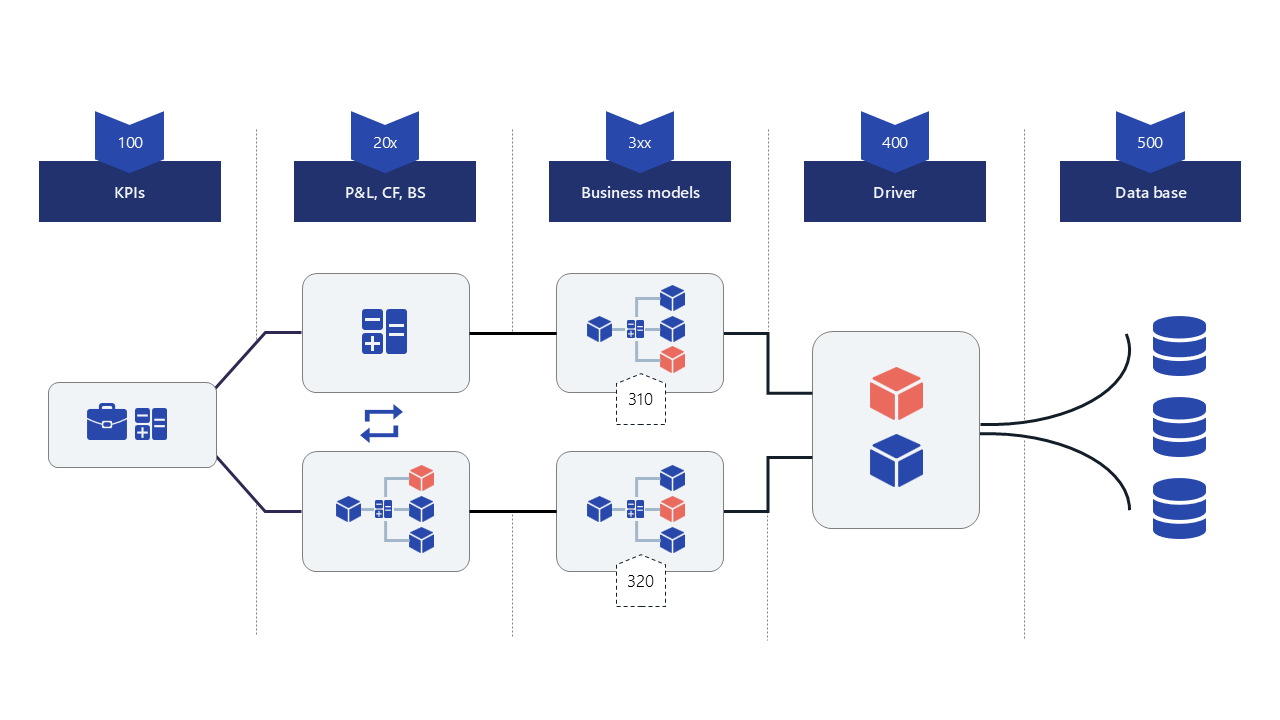
Name the different models with numeric prefixes and clear purposes.
Name submodels with numeric prefixes and clear purposes. The submodel structure can be visualized by clicking Model Graph in the upper right corner of the Model overview.
Prefix | Name | Purpose |
|---|---|---|
500_ | Data (Tail) | Raw inputs and source mappings. Nodes connect to data sources or perform basic cleaning and mapping. |
400_ | Drivers | Common assumptions like growth rates, FX rates, inflation, or standard cost rates for consistent reuse across the model. |
3XX_ | Operational Detail | Separate submodels for major operational areas (sales volumes, pricing, production capacity, costs, headcount). These calculate operational metrics that feed financial results. |
2XX_ | Financial Calculations | Financial statements and calculations (P&L, cash flow, balance sheet). Aggregates operational outputs into financial results. |
000_ | KPIs (Head) | High-level KPIs and ratios. Reduce dimensions where appropriate to focus on management-relevant views (e.g., Time and Region only). |
Notes
Respect the flow direction
Ensure dependencies only point forward (right to left on the canvas). Nodes in earlier submodels (for example,'Sales'or'P&L') should be available to later ones (like'KPIs'), not the other way around.Use submodels for access control
If different users should only see parts of the model, restrict access at the submodel level. This allows, for example, OPEX owners to work in cost submodels without exposure to the full model.
Result
Your model is now structured in clear layers—from data input on the right to detailed calculations, financial consolidation, and KPIs on the left. This structure improves readability, reduces complexity, and makes collaboration and scaling significantly easier.
Related Documentation
Models to add new submodels to your model