
Scenario Colors
Learn why scenario colors are important, which parts can be colored and how to choose the proper colors for your scenarios.
Basic Overview
Scenarios can be colored to better trace their influence on your simulations
Assigned colors will be represented in created charts and tables
Colors can also be used to improve the appearance of your Scenario Manager, Assumption Groups, the Workspace, and Charts
Coloring Scenarios
Coloring scenarios serves different purposes.
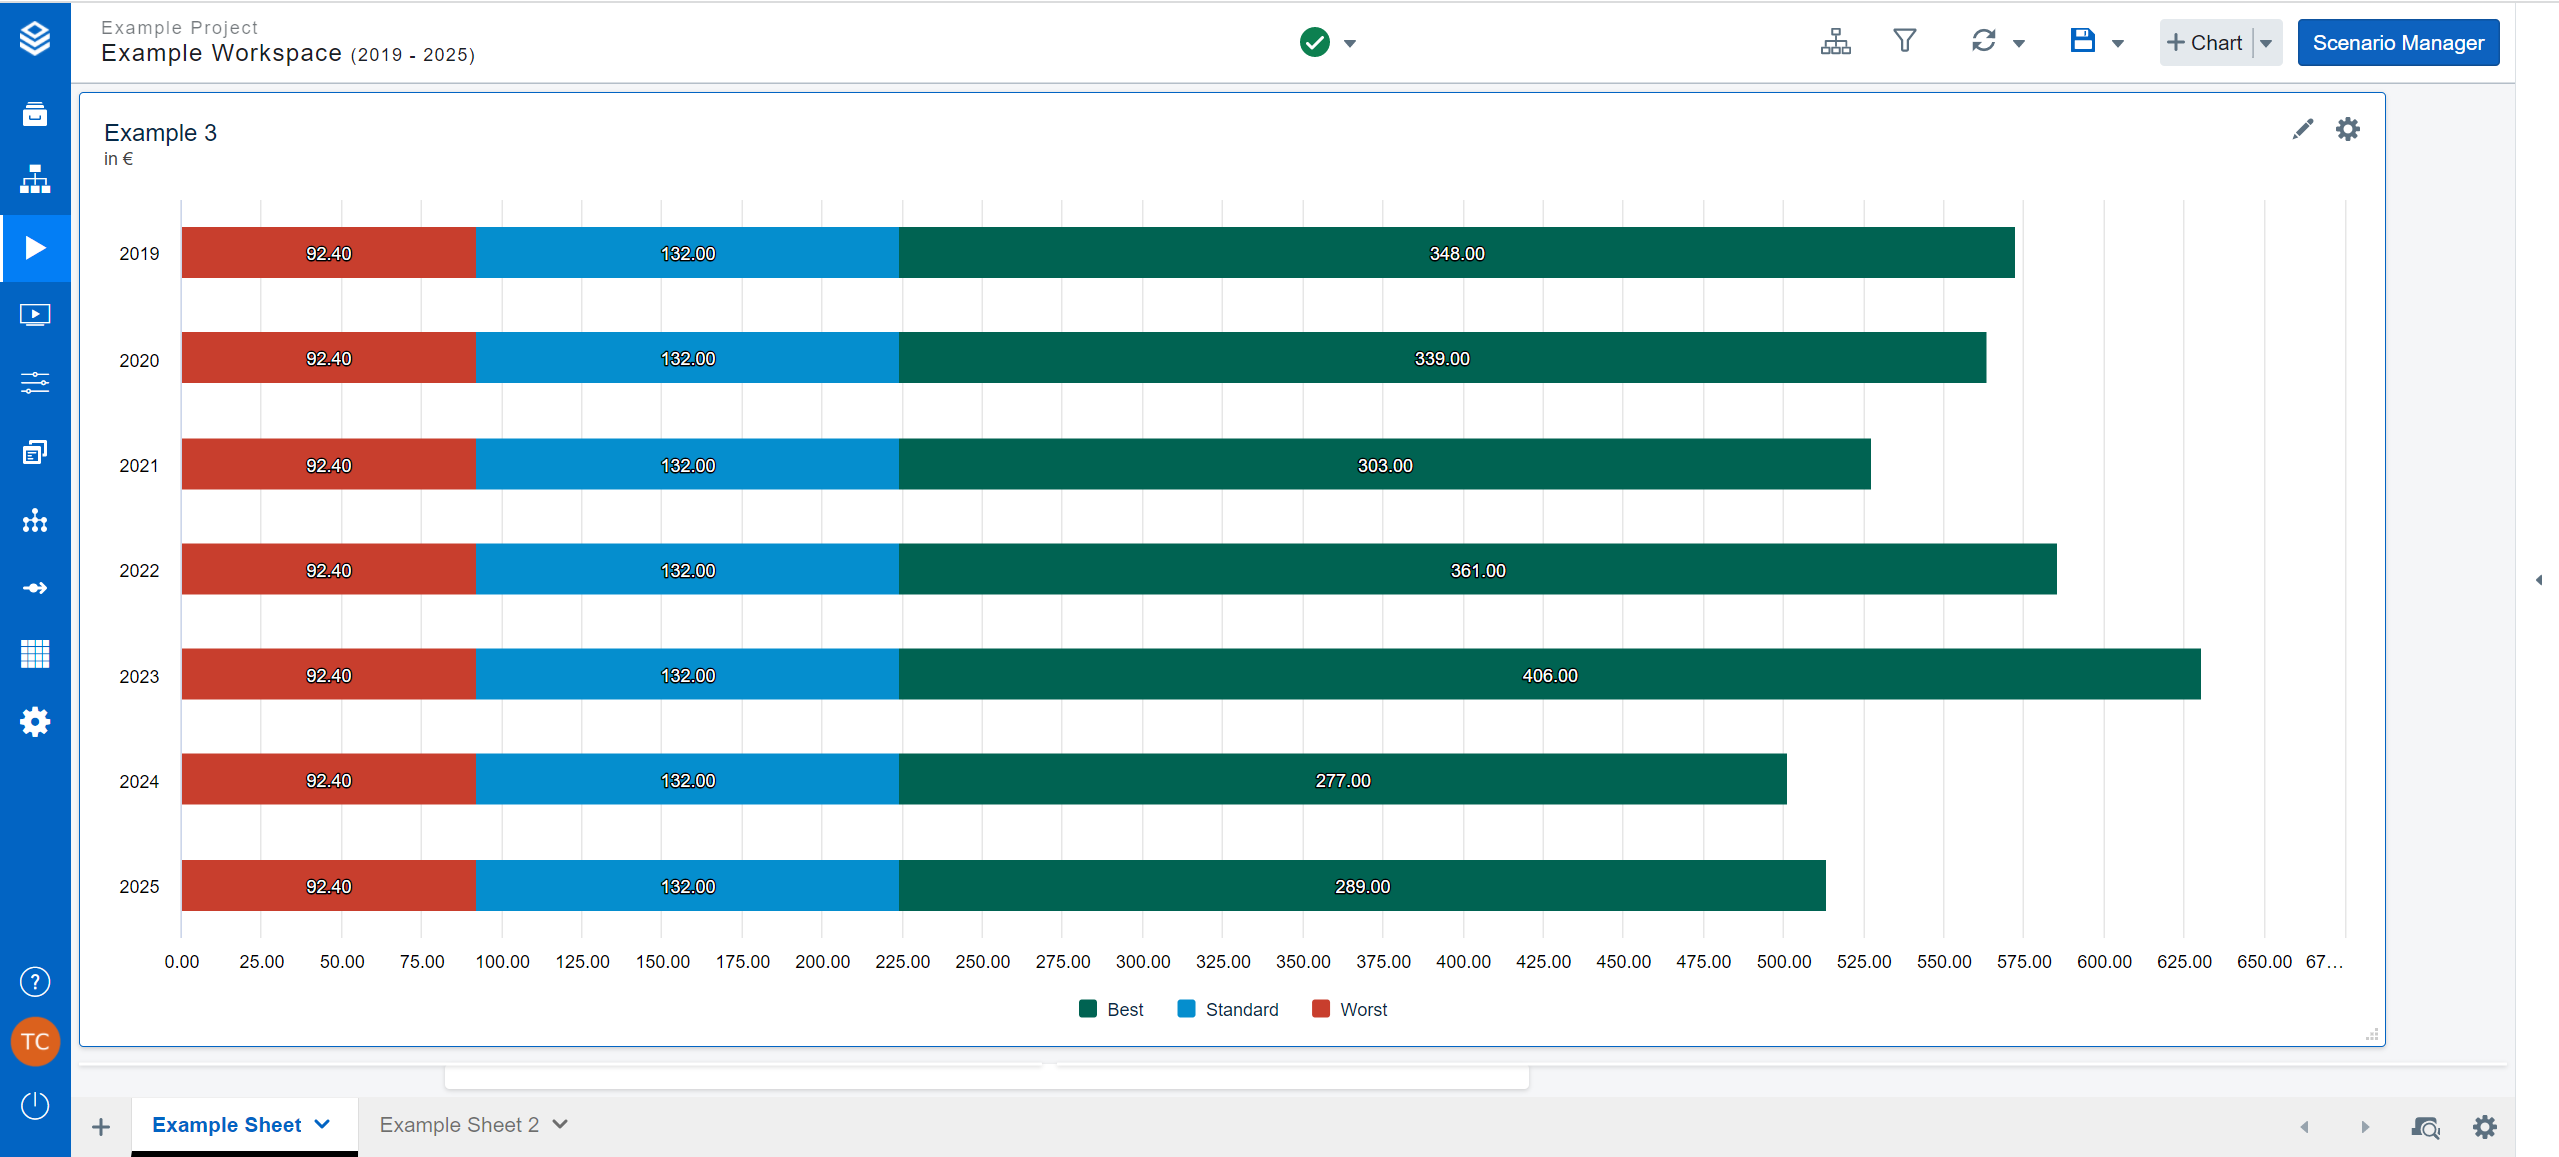
It allows you to increase clarity. By assigning specific colors to your scenarios, their impact on charts and tables becomes more visible.
That allows you to quickly identify their influence on simulation data.
Additionally, you can improve the readability of your visualizations by combining specific scenarios with recurring colors.
Increasing Clarity
If you assign a color to a specific scenario, that scenario will be represented in the same color in data visualizations in your Worksheets.
Graphs and their respective legends will display the assigned color for the scenario, allowing a faster analysis of its role in your simulations.
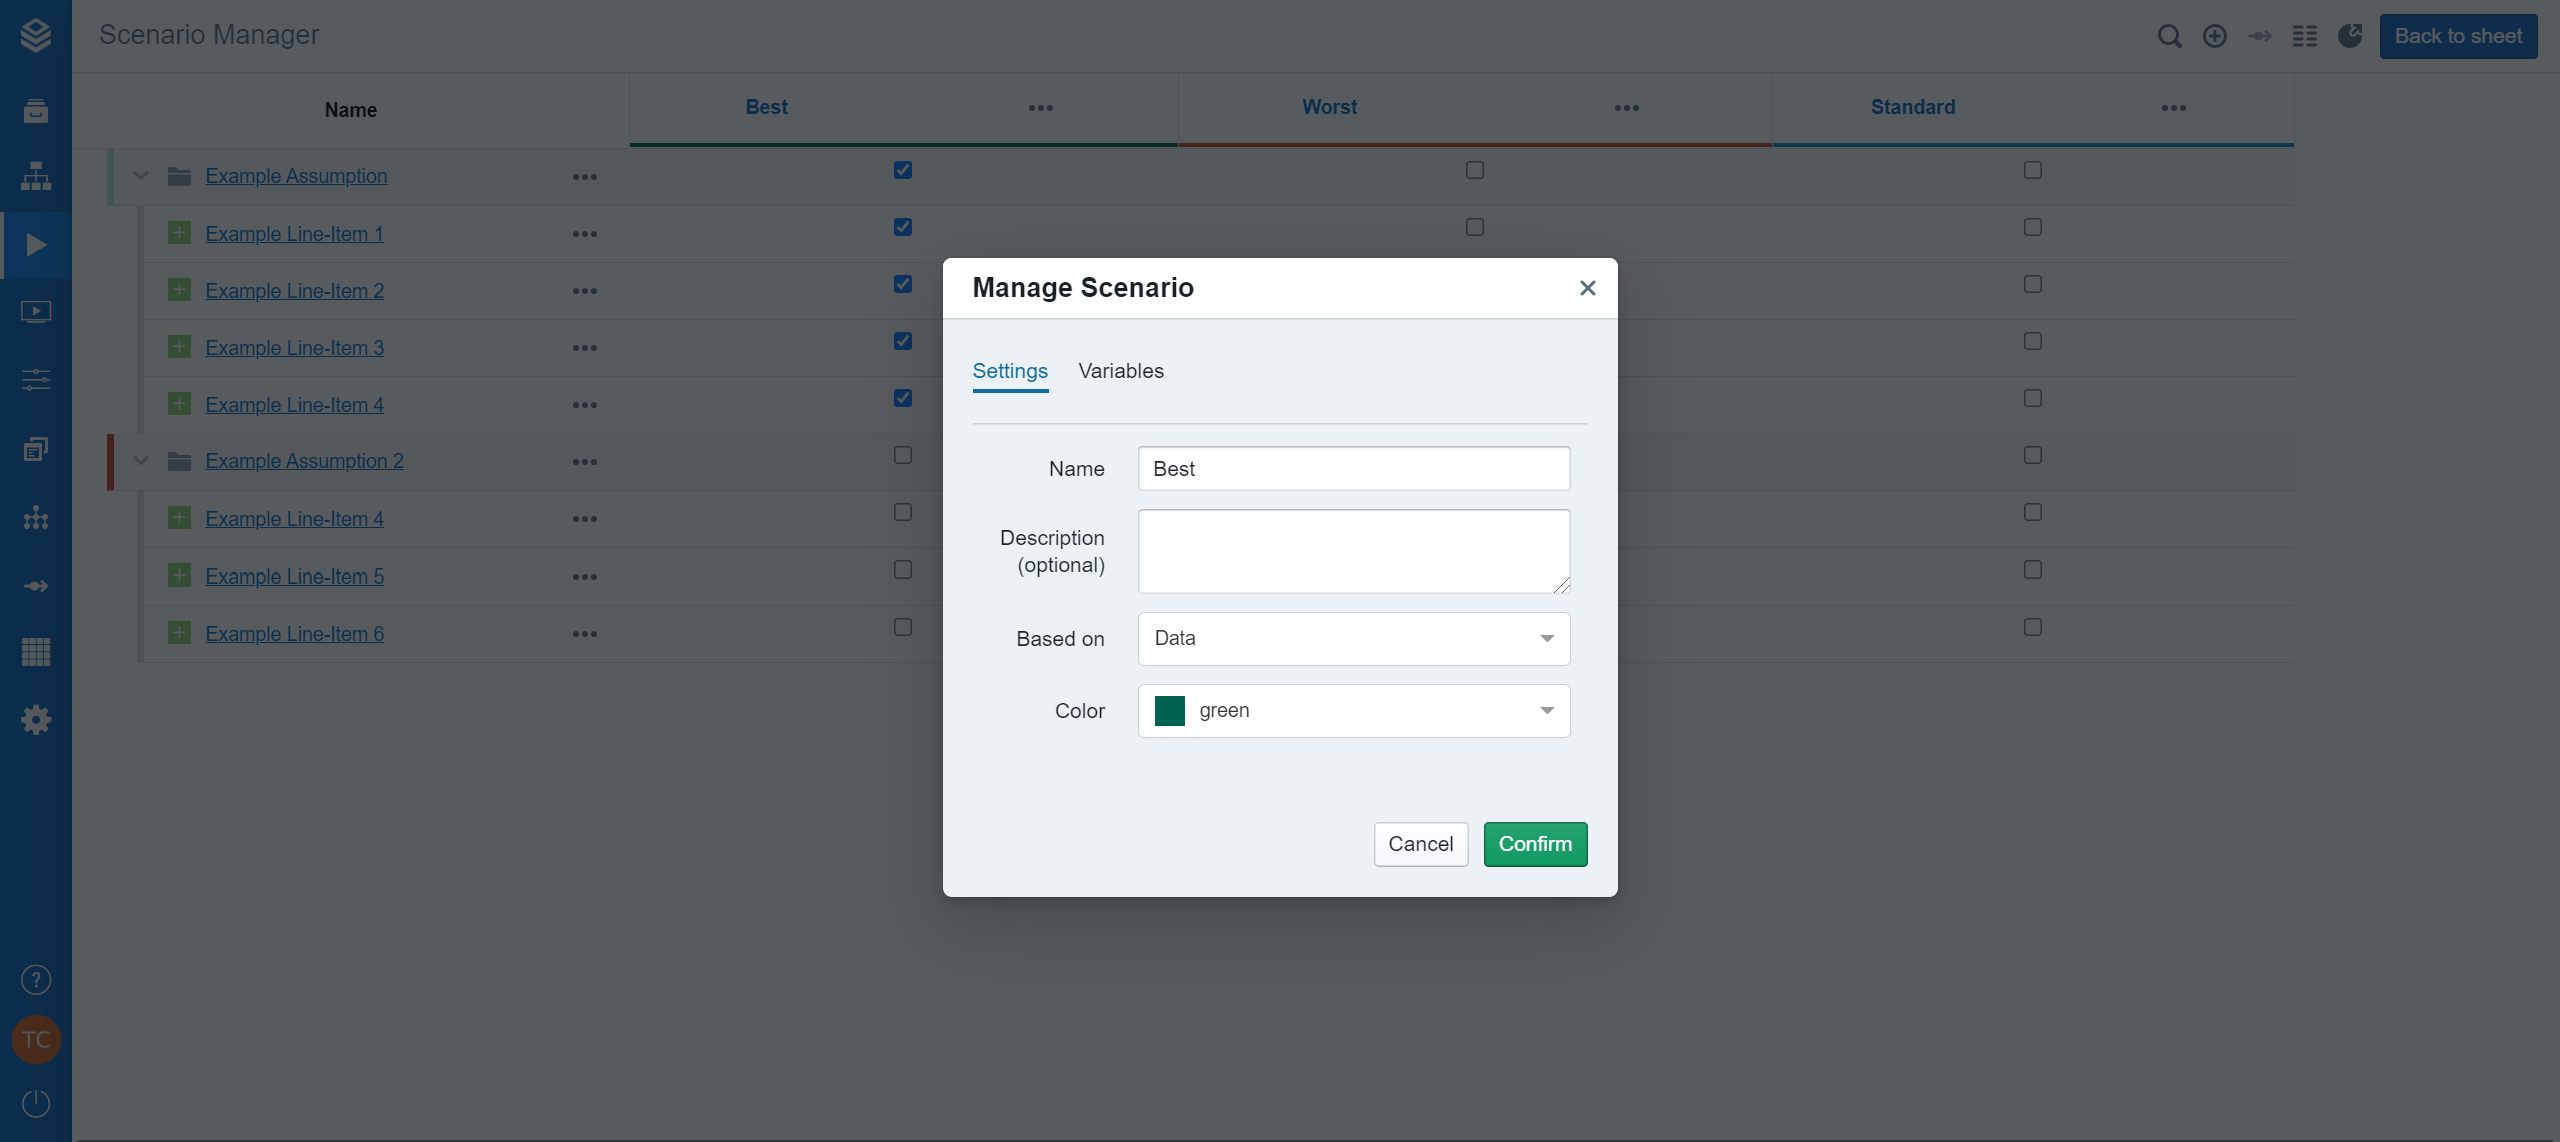
Additional Coloring Information
Common examples are green for "best" cases or red for "worst" cases, with neutral colors such as blue for "standard" cases.
An important aspect of proper color coding is consistency. By using the same colors for equivalent scenarios, especially across different projects, you can help other users understand your workspace and the presentations generated from it.
Valsight default is a collection of 14 colors with high contrast, to allow an effective highlighting of information.
It is possible to implement a custom color palette. This enables you to represent your data in accordance with your corporate identity.
See details at Editing the color palette .