
Release Notes 4.1.0
Valsight version 4.1.0 changes bridges, tables and the general design of the workspace.
Bridges with intermediate sums
Bridges can now display more than two grey columns. Add multiple years or scenarios to your bridge to have them displayed as intermediate sums in the bridge. Learn more on how to setup your bridge correctly on this page.
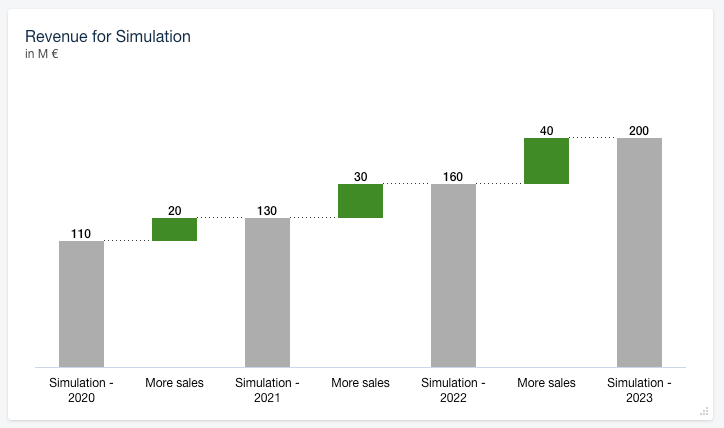
We also added options to all charts to hide grid lines, the y-axis and the legend (as seen in this bridge).
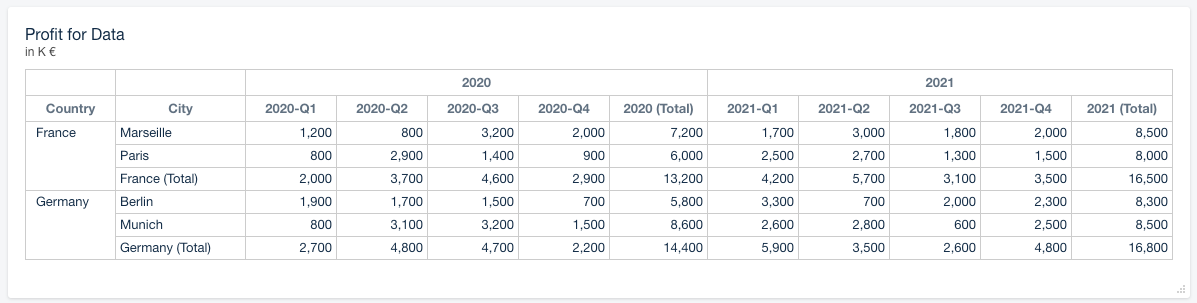
Merged cells in tables
Cells in the table header or on the left side are now merged to help you skim through hierarchies easier. Learn how to setup a table like this on this page.
Secure Statistic Collection
Statistics about the usage of Valsight help us to create better features, improve existing functionality and identify and fix potential technical problems. We added a statistic collection mechanism that is secure, follows the principle of data avoidance and allows to include customers in the cloud and on-premise without the use of any third party software. Find more information here.
Workspace redesign
We have cleaned up the look of the workspace. Chart tiles, the header and the sidebar have been redesigned, so that they are always there when you need them and gone in a moment when you don't.