Release Notes 6.5.0.
The major Valsight 6.5.0. version features multiple enhancements to visualisation of charts for a better understanding of cause-effect relationships, helpful tools for workflow admins and contributors as well as improved line item exporting and importing features. Major features in this release include:
Bridge Chart Functionality Improvements
General Chart Style Improvements
Reworked Workflows Dashboard & Functionality
Improved Line Item Exporting and Importing
New formula: Fillmissing_last
Bridge Chart Improvements
Non-Assumptions on Bridges: Configure scenario and time bridges with items other than assumptions as deltas. This enables i.e. the configuration of a scenario bridge, which uses dimensions to transition from one scenario to another.
New Configurator: The bridge configuration wizard has been redesigned. It is now more intuitive and offers more customisation options to easily configure the bridge you want. Read the full bridge documentation including the new non-assumptions on bridges here.
Chart Style Improvements
Updated Tables: Table charts have received an updated look and now feature custom column width. Activate the setting ‘modern’ in the inspector to try it out.
Assumption Descriptions in Bridge Charts: Bridge charts now include visual support with assumption descriptions being visible on hover over a charts element. Activate this setting via the ‘Show description in tooltip’ setting in the inspector.
Real Size: There now is a ‘real size’ button when configuring a chart to preview its actual size in the workspace. This allows for a more accurate configuration of the chart.
Adjustable Font Size: It is now possible to alter a charts text font size when in highlight mode for an improved readability.
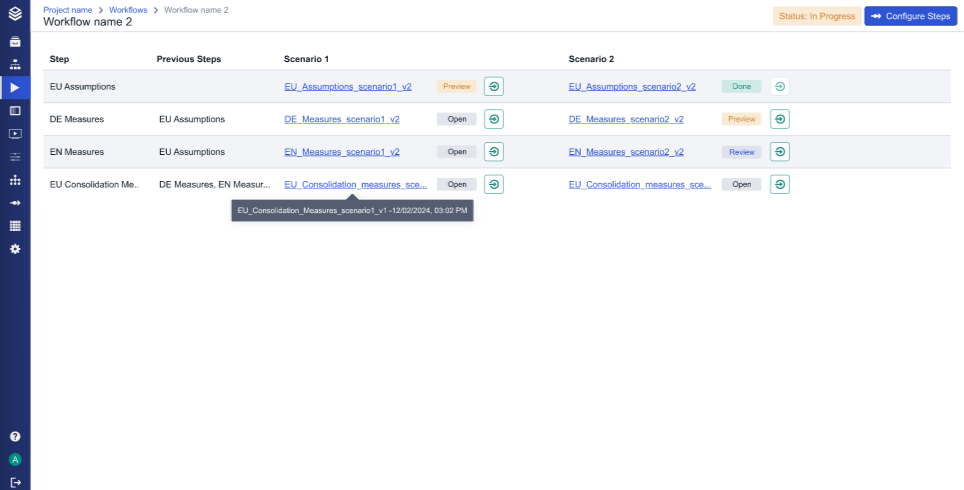
Workflows Dashboard

The workflow management dashboard has been completely redesigned to give administrators more control and visibility over a running workflow, with the following additions to the page:
Visible step dependencies
Scenario input, version and time
Faster step promotion
User-defined sorting of steps for logical order
View our Workflow documentations here.
Exporting & Importing of Line-Items
It is now possible to export line-items in a pre-defined ‘change view’. The table can be pivoted to match the user's Excel format. The user can then complete the Excel and upload it back into Valsight
We keep the logic of the formatting, which means that even if another user changes the format of the view in Valsight, the user will still be able to upload their Excel without any problems
Learn more about exporting and importing different types of data here.
Further Improvements
New Formula - FILLMISSING_LAST: Fills holes in tables with the last value available on the desired dimension.
Improved Data Sources UI: New look for the date source management pages.
Group Assumption Effects: Now also groups line items with variants.
Charts are no longer reloaded when updating visual settings to reduce loading times and allow faster design iterating.
Greater flexibility to show and hide numbers in charts, and better understanding of whether the data series or the values for the whole chart are being shown.
Numerous bug fixes and performance improvements.
For detailed information on these features and more, visit our full documentation.
Happy Simulating!
