
Part 6: Analyze Results
In this part, you create different chart types to inspect the simulation results .
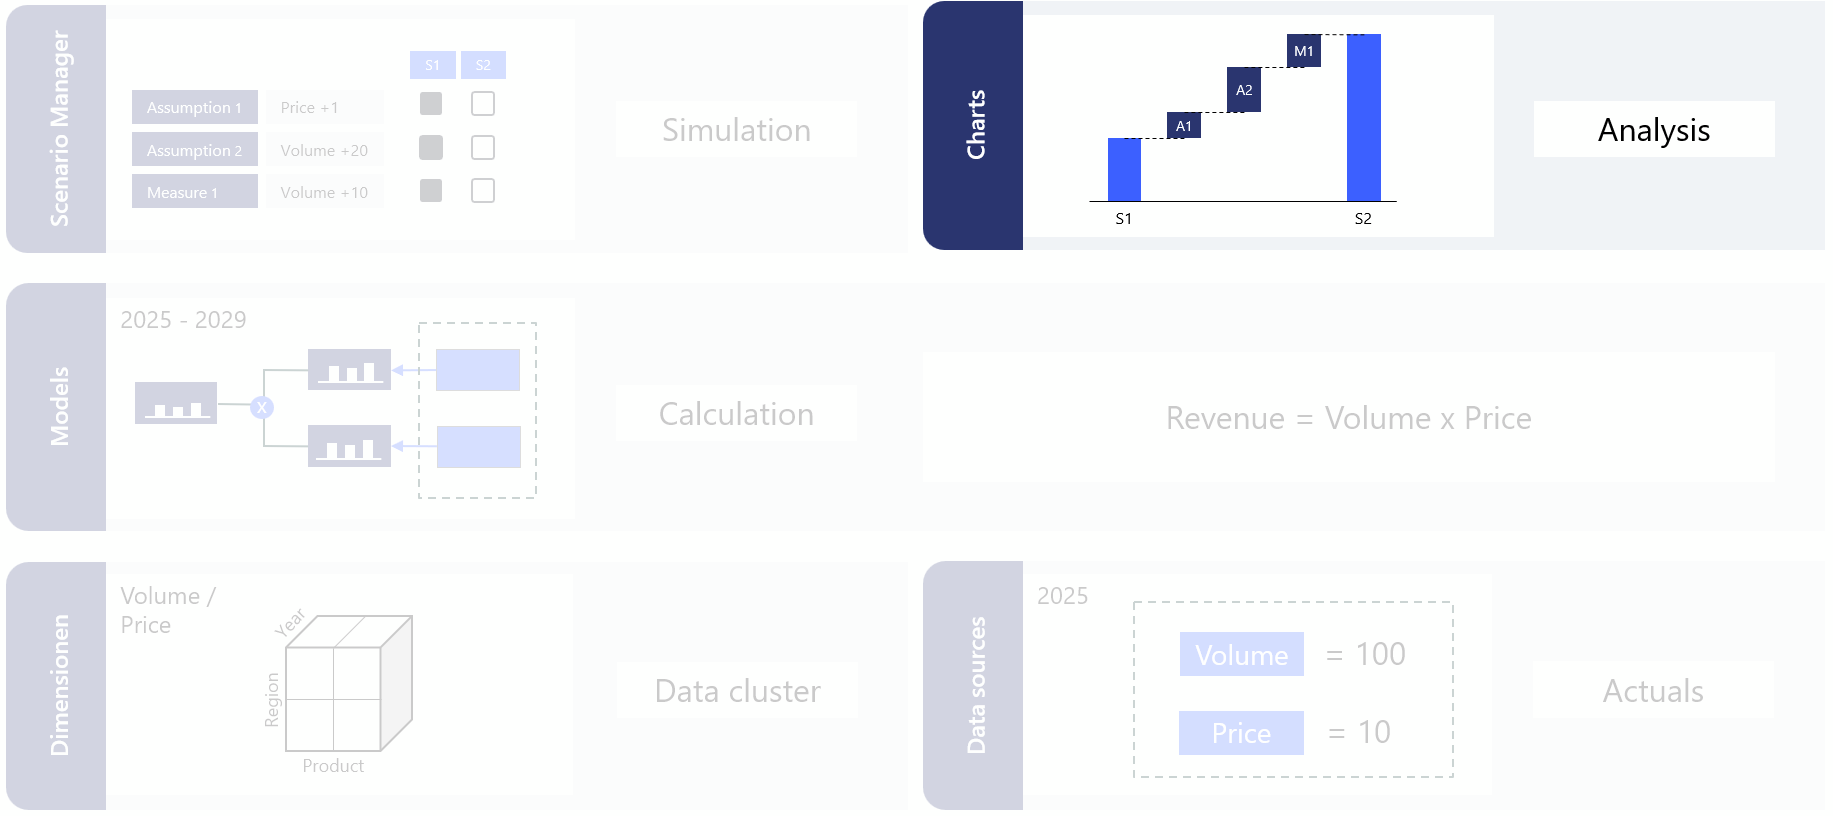
Analysis in Valsight is using charts, bridges, and tables to compare scenarios, understand changes, and interpret model outcomes.
For detailed reference on any of the concepts here, see Visualizing Data.
Watch the video guide
Step 1: Create a column chart
Navigate back to sheet.
Click Add chart.
Choose Column chart.
Select Revenue as the measure.
Chose Simulation as the scenario.
Create the chart.
Open Configure axes
X-axis: Year (default)
Groups: Remove "Scenario" and add Product instead.
Enable Stacked view using the checkbox below the chart type selector.
Enable Totals and select Combined sum to show the combined revenue for both products.
Under Scaling and Digits, set the scale size to Thousand and decimal places to 0.
Click Save.
The bar chart shows Revenue by Year, stacked by Product, with totals displayed.
Step 2: Add the Scenario Manager as a chart
Click Add chart again.
Select Scenario Manager.
Create the chart.
Activate or deactivate assumptions and immediately see the results update in the bar chart.
Step 3: Create a scenario bridge
Click Add chart.
Select Scenario bridge.
Select node: Revenue
Choose the two scenarios you want to compare.
Choose Assumptions for Comparioson
Select the year 2029 for display.
Create the bridge.
The bridge now shows how much "Price Adjustment" and "Volume Change" each contribute to the revenue difference between the data baseline and the Simulation scenario in 2029.
Step 4: Create a table
Click Add chart.
Select Table.
Select Volume, Price, and Revenue
Choose the Simulation scenario and click Create.
Set Aggregation type of Price to Weighted Average in the Model Editor.
Open Configure axes:
Remove Scenario from the columns
Add Year to the columns.
Under Rows click on Sort and place Revenue on the latest position.
Under Columns click on Create Comparions
Reference value: 2025
Comparison value: 2029
Type: CAGR
Under Formatting and Rows, set Revenue as a grand total row and indent Volume and Price.
Click Save.
What you have done
Added the Scenario Manager to the workspace
Created charts to analyze KPI development
Summary
Congratulations! You have built a complete Valsight project from scratch:
created a project
set up dimensions and uploaded data
built a driver model
simulated assumptions
analyzed the results
Key functions used
Function | What the function does |
|---|---|
Pulls values from an uploaded data source into a node | |
Carries forward the last available value, optionally applying drivers | |
Creates a dimensional structure for an empty node |
Next steps
Add more scenarios in the Scenario Manager and compare them
Experiment with Line-Item Variants like Best, Realistic, and Worst
Explore the Function catalog for additional modeling functions
Learn more about Structure Driver Models in the Valsight documentation