
Release Notes 6.8.0
Valsight version 6.8.0 introduces powerful new features to improve collaboration, data input, and project management. The highlight of this release is a brand-new Chart Type that allows users to enter data directly within their workspace, streamlining scenario modeling. Workflows have been further refined to enhance team collaboration, making it easier to manage contributions across departments.
Additionally, a read-only indicator has been introduced, providing better visibility into project rights at a glance. On the technical side, smart copy-paste functionality makes working with data in Valsight even more intuitive.
Highlight Features:
New Chart: Enter Data Directly in Your Workspace
Improved Collaboration: Enhanced Workflow Management
Better Project Rights Overview: Read-Only Indicators
Technical Enhancements: Smarter Copy-Paste and Performance Improvements
Input Tables – Simulate Directly in Your Workspace
With Input Tables, you can now enter data directly in the Workspace, instantly visualize changes, and adjust assumptions on the fly—without switching screens. This new chart type streamlines scenario modeling, making it easier to test different inputs and immediately see their impact.
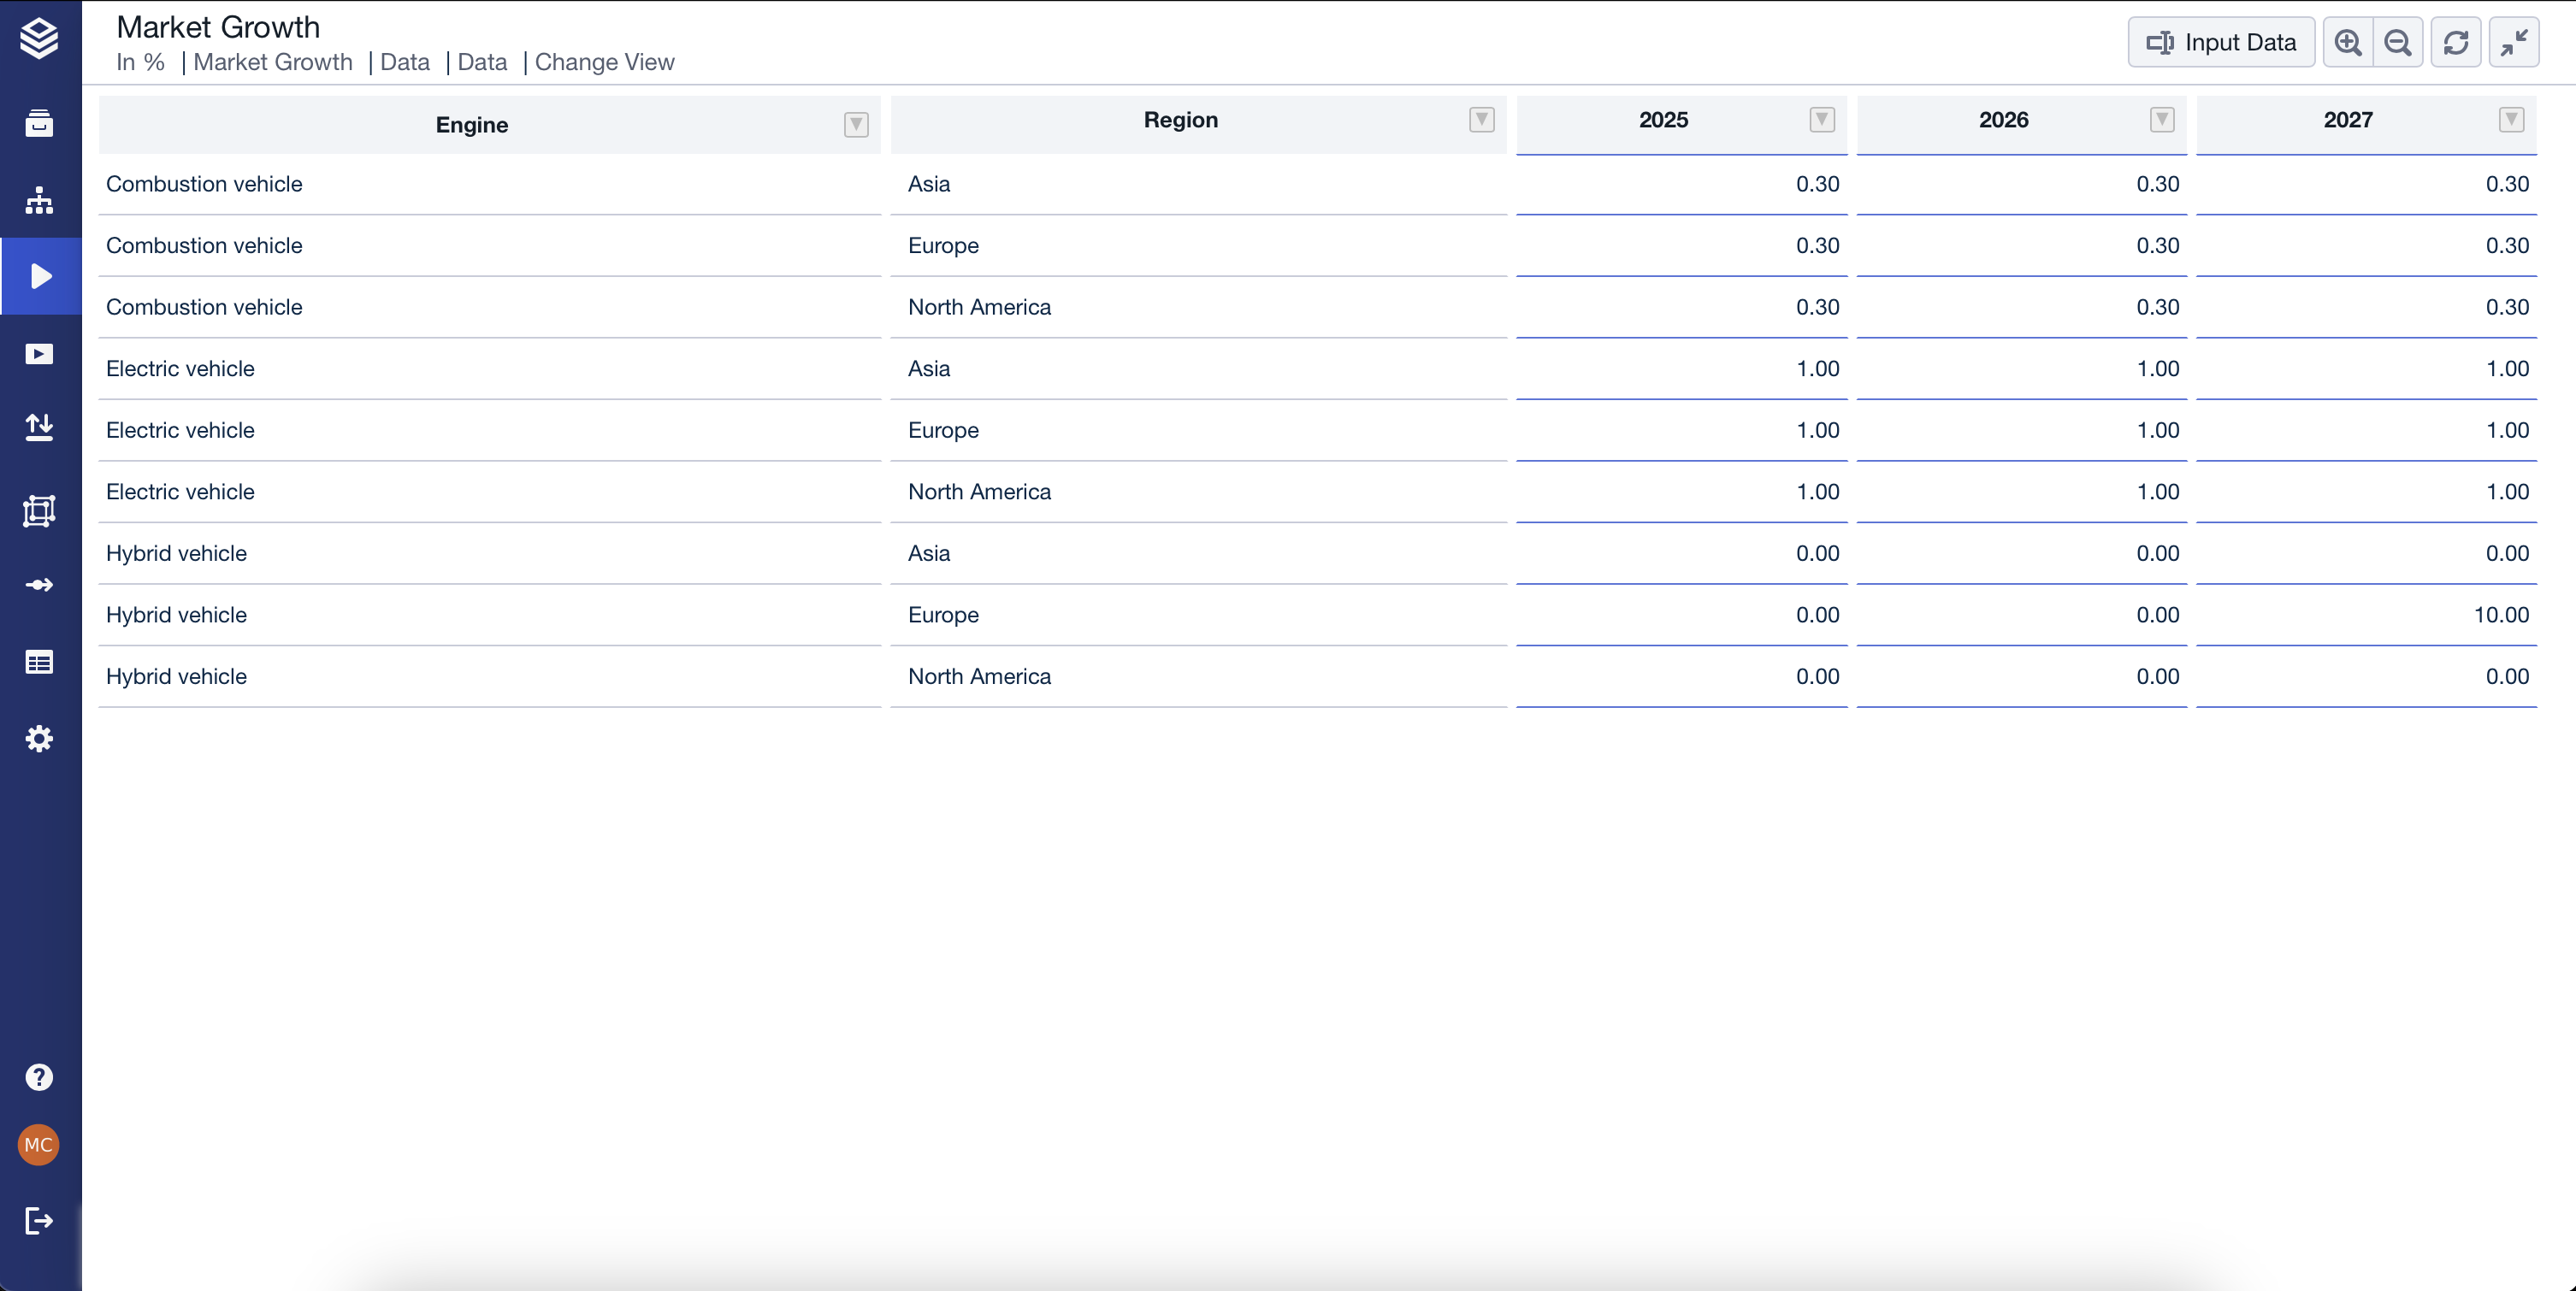
Highlight mode - Input Chart. Change view
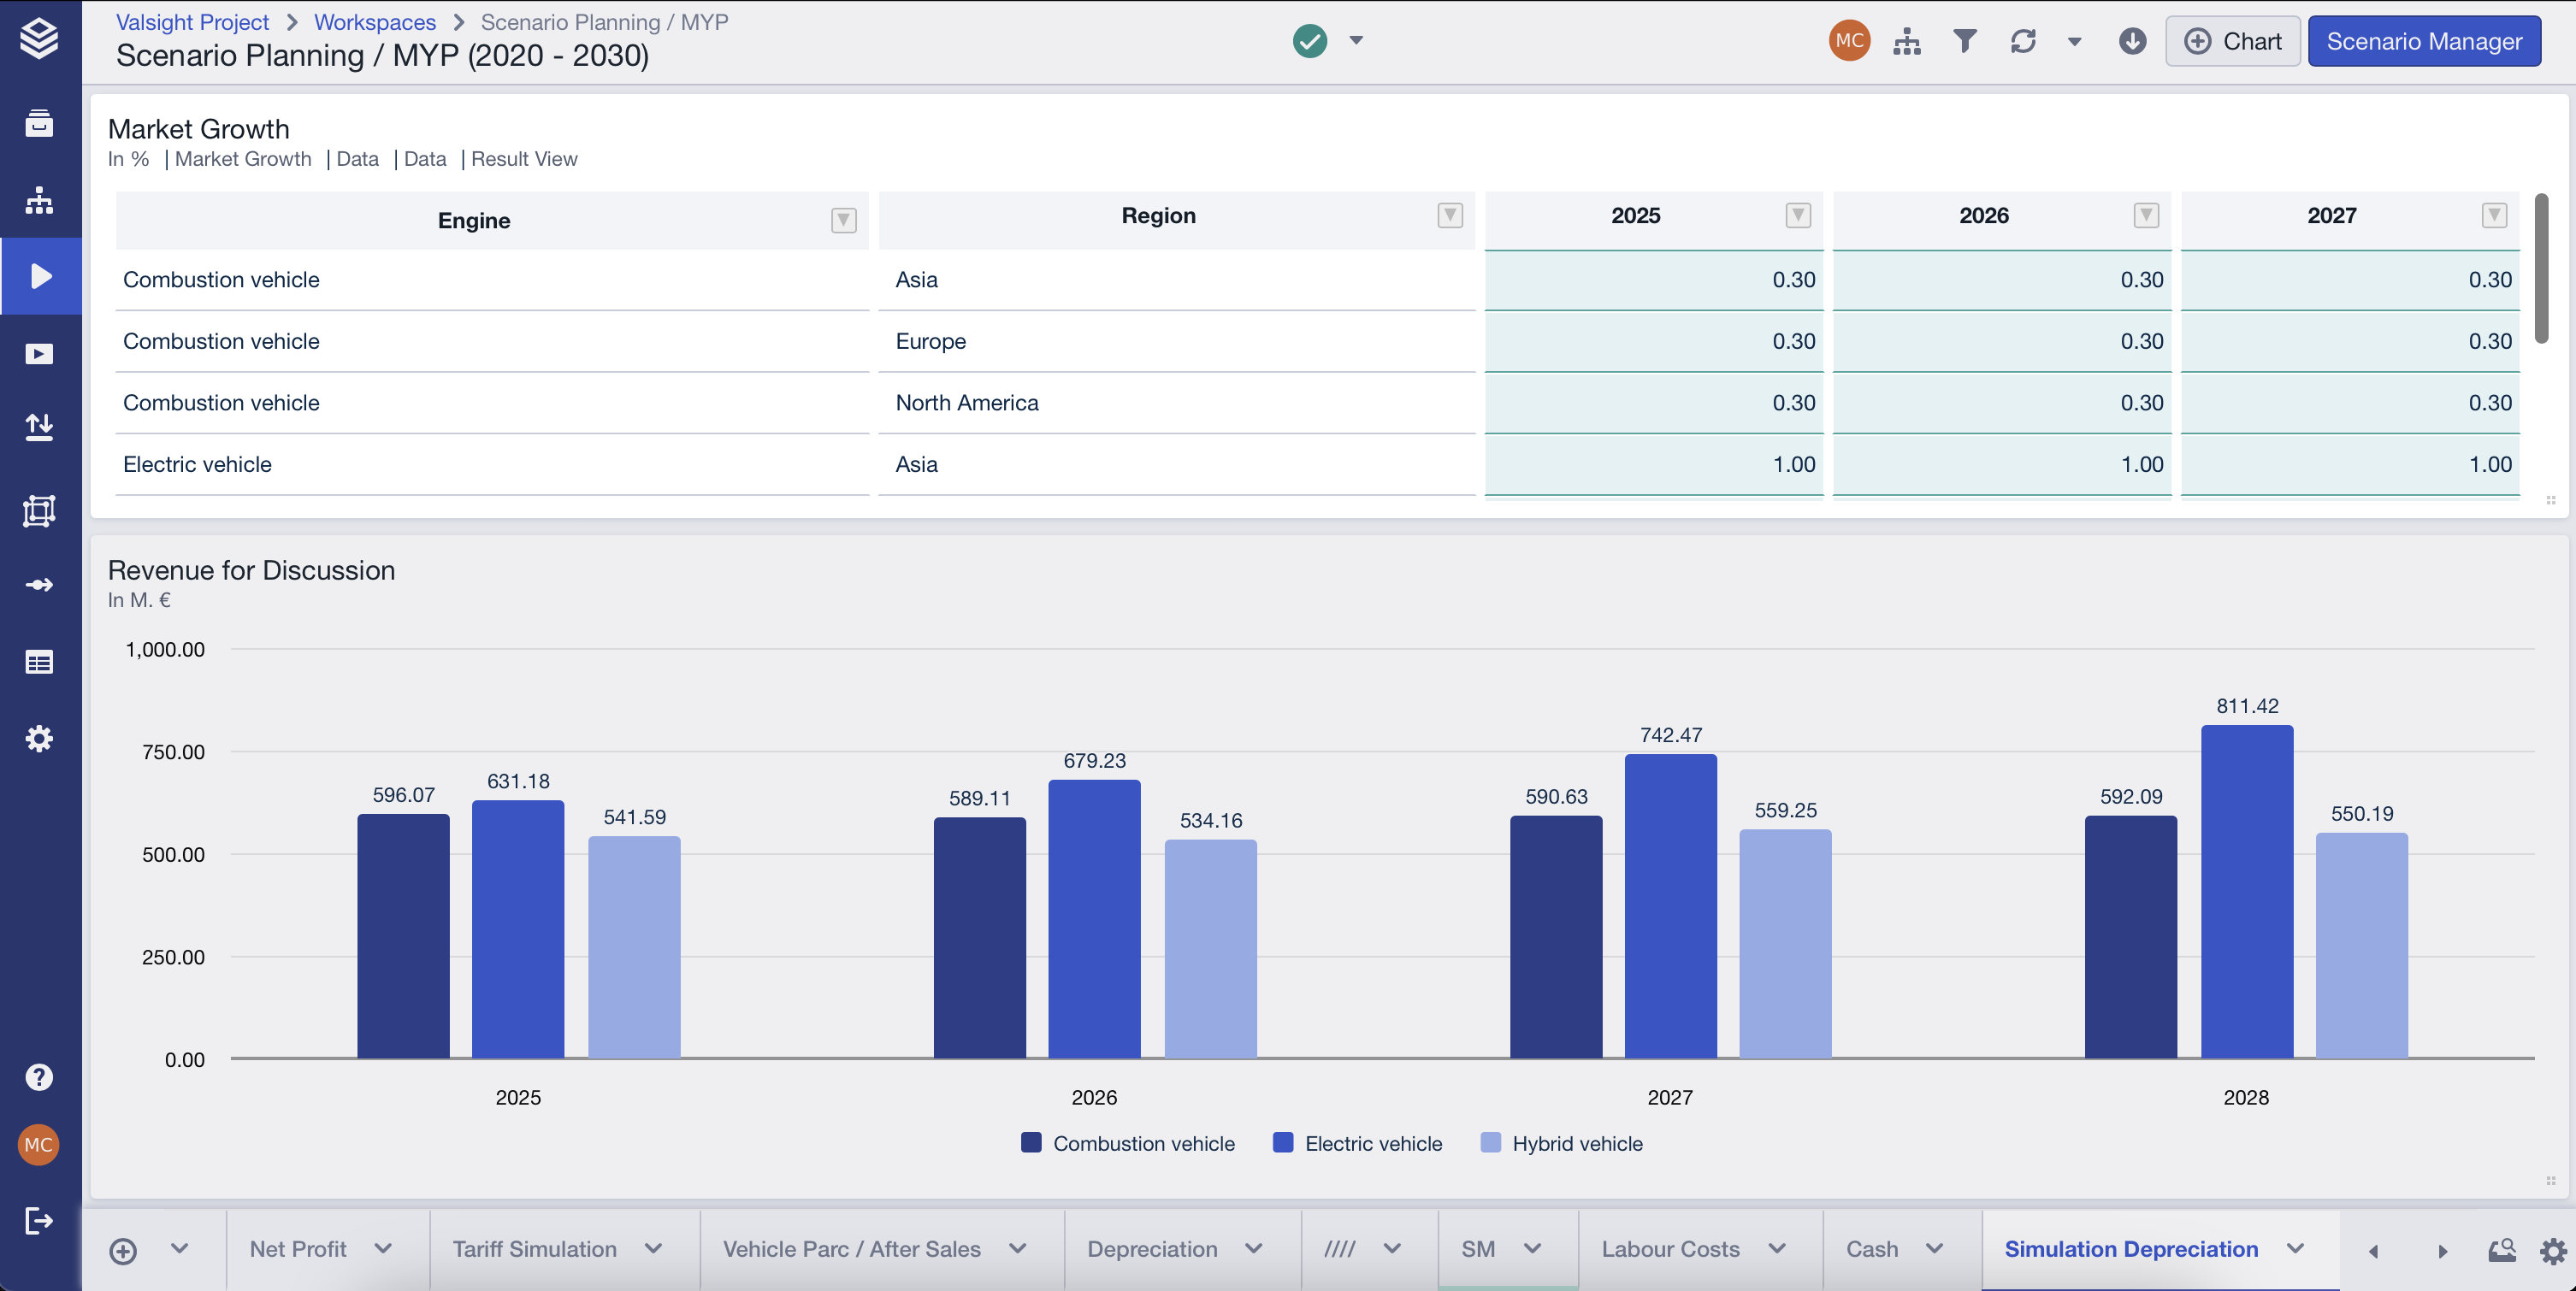
Data input mode - Result view
Once added, it is possible to modify data in two views: Change View, for relative adjustments and Result View, for absolute values. Filters, perspectives, and sheet settings automatically apply, ensuring a focused analysis. Changes update all linked charts in real time, providing a seamless and more interactive simulation experience.
Simulation Charts Category in the Chart Wizard

To improve usability, we have introduced a dedicated "Simulation" category in the Chart Wizard, making it easier to find charts designed for direct scenario modeling. This category includes:
Scenario Manager Chart
Input Table (previously Line-Item Table) – Allows users to enter change values directly in the workspace.
Sliders
Improved Workflow Management

The Workflow Manager and workspace interfaces have been enhanced for a more intuitive and efficient experience. Key improvements include:
New Action Buttons: Dedicated buttons for "Start," "Stop," and "Complete" have been added to the Workflow Manager, dynamically displayed based on workflow status. A Demote button is also now available to reverse workflow step progression when needed.
Status Tags: Workflow steps now display clear status tags, such as "Unstarted" or "Completed," for improved visibility and understanding.
Simplified Submission Flow: Notifications for available input steps and guidance have been improved in the Workspace.
Read-Only Status Indicator for Models
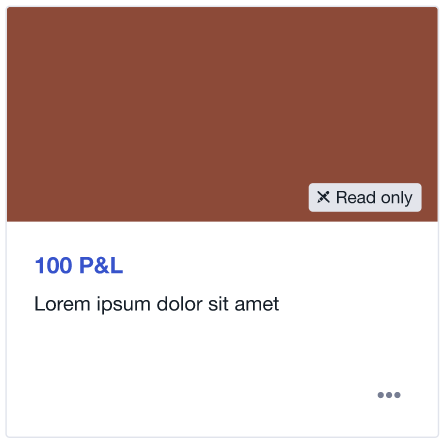
Users with read-only access can now easily identify their permissions on the Model Overview page. A "Read-only" tag is displayed on tiles (bottom-right corner) and in a new Status column for the list view, helping users understand their access levels before entering a model.
Other Improvements
Copy and paste support for percentages and numbers with thousand separators has been improved, for a better data entry from sources like Excel. Based on Valsight's language settings.
Validation for data source changes: Before saving changes to a data source name or deleting a data source, users will now receive a validation and warning message. If the action would invalidate any nodes, a usage report will display the impacted areas.
Improved node validation redirect: Users are now redirected to the correct model and node when selecting "View Node" from a different model, ensuring seamless navigation or an appropriate message if access rights are missing.
Improved time display for exports: The "remaining time" in the Export Manager now rounds up for better consistency.
Enhanced variable overwrite handling: Users can now pin a variable in the Scenario Manager to the same value as the default variable, ensuring it remains unchanged even if the default variable value is updated.
Workspace chart responsiveness settings: Users can now override the instance default for Responsive Chart Text Size at the workspace level, ensuring flexibility for new and existing workspaces.
For detailed information on these features and more, visit our documentation.
Happy Simulating!