Release Notes 6.4.0.
Version 6.4.0. brings a number of exciting updates focusing on improving the workflow and process management within Valsight, improvements to the formatting and design of our charts and a new formula. Our aim is to make data visualisation more intuitive and workflows more efficient, ensuring that even casual users can navigate and contribute with ease. Here's a detailed look at what's new:
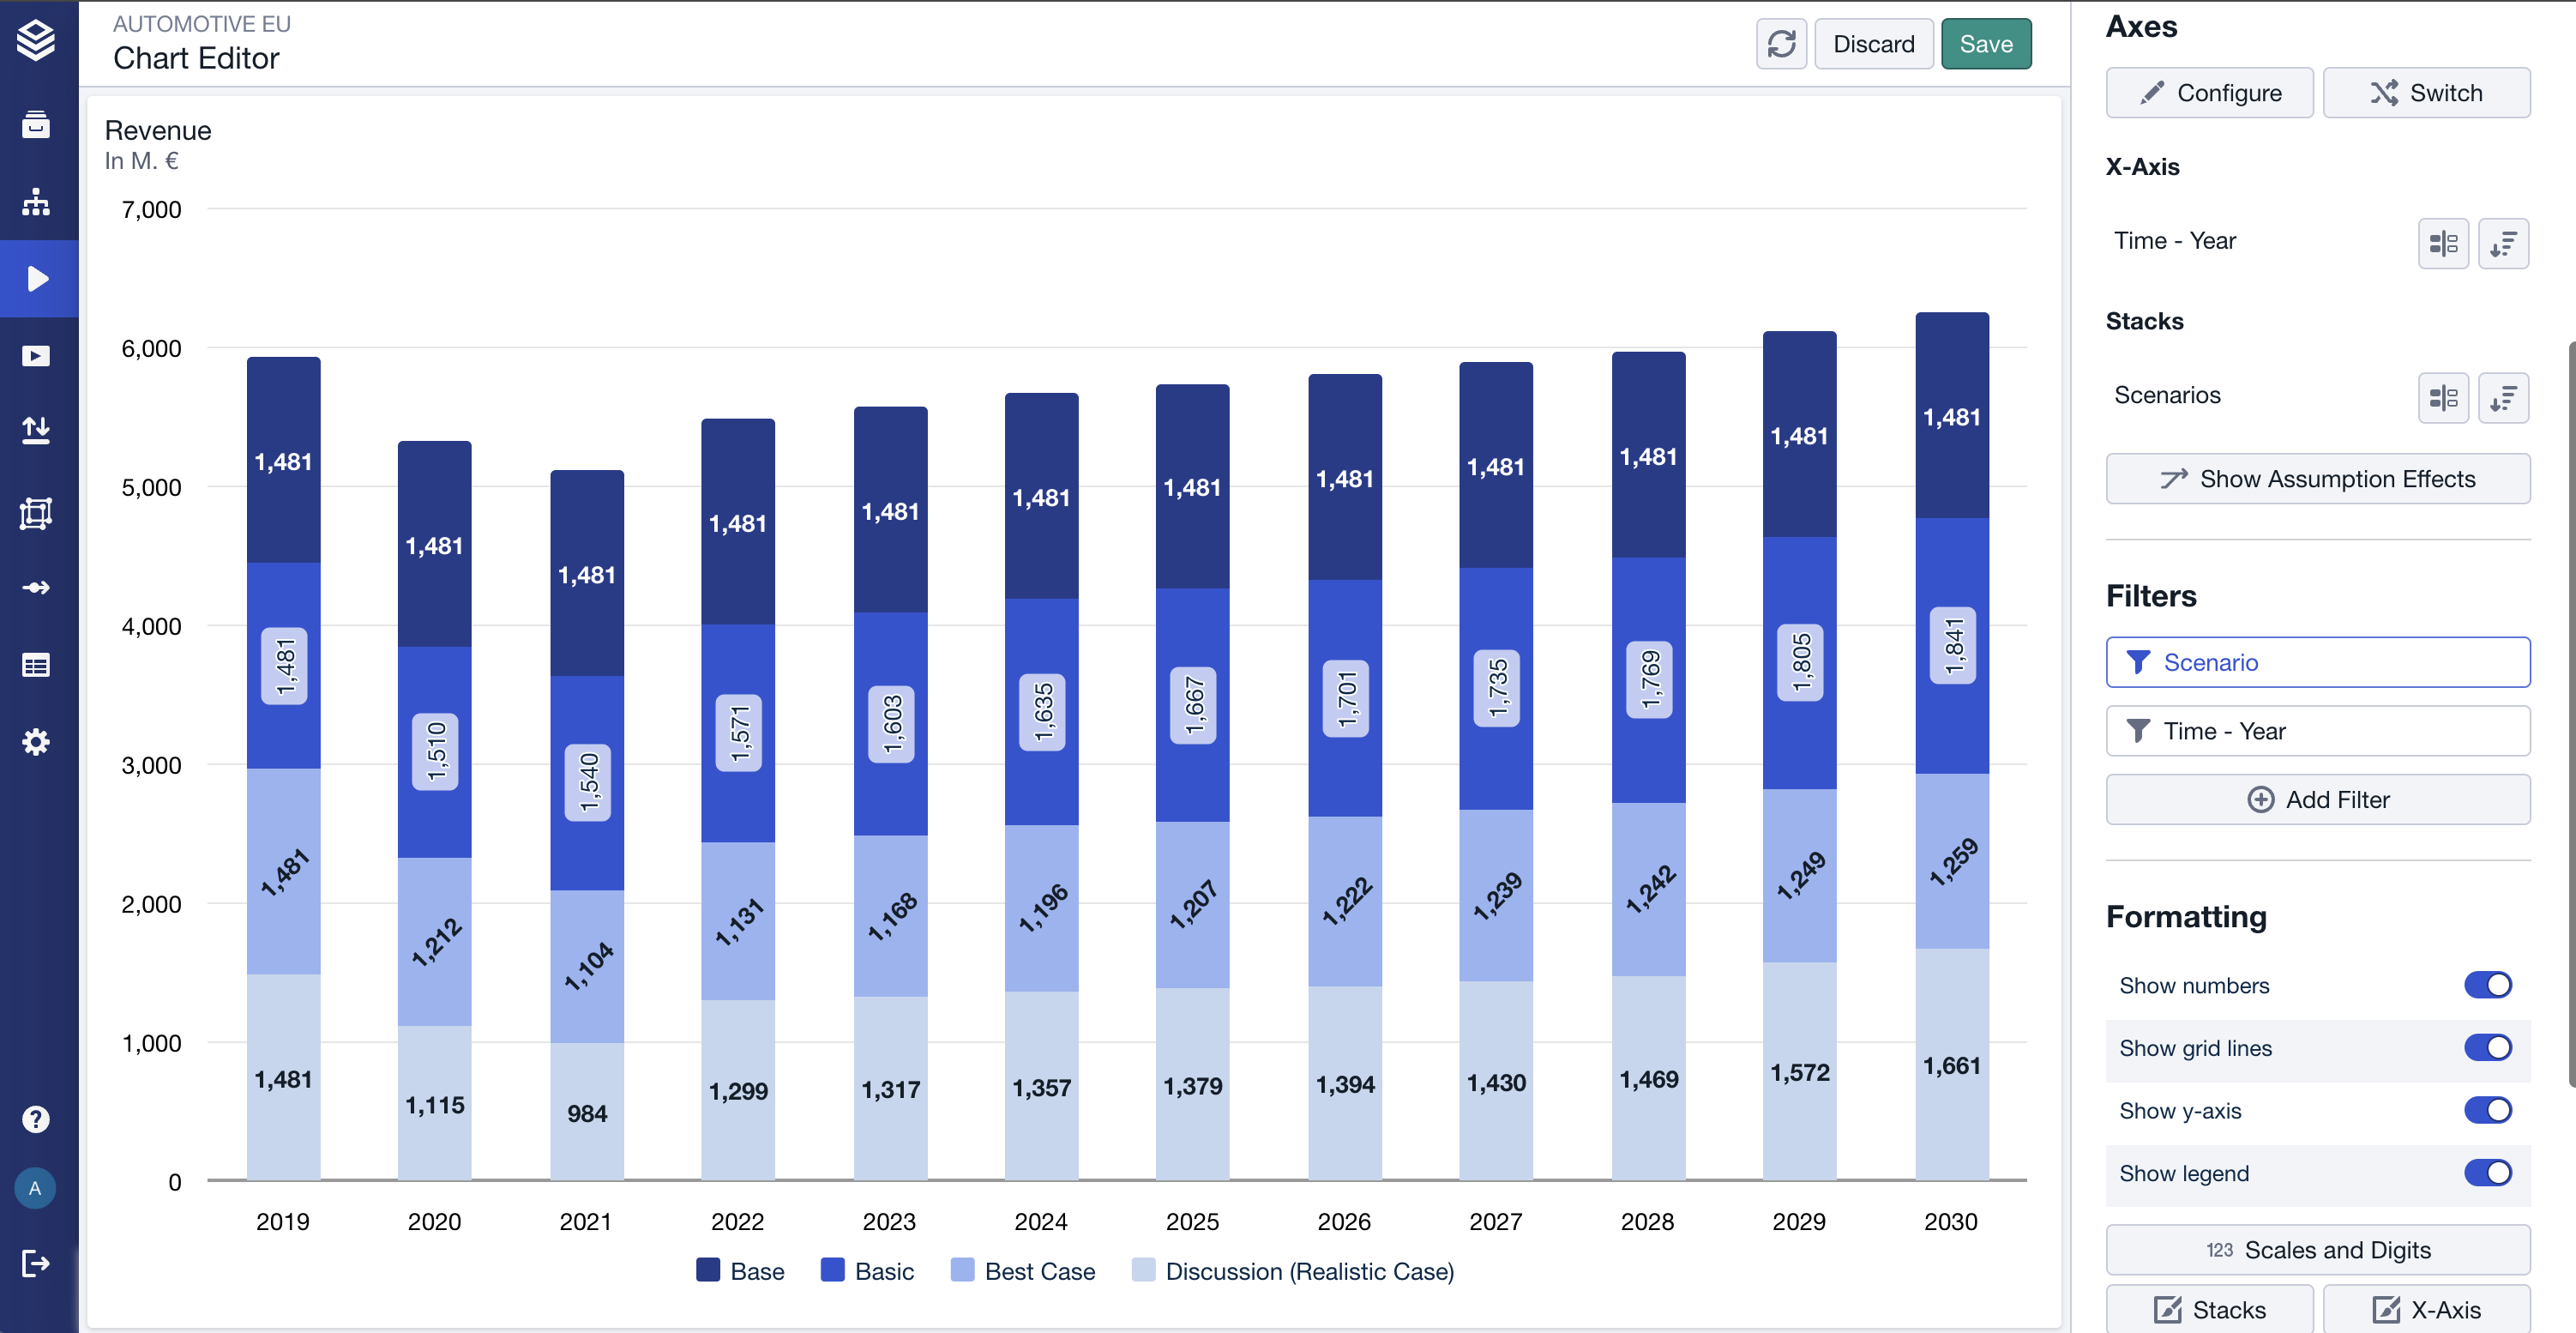
Improvements to our charts with a focus on customisation and readability
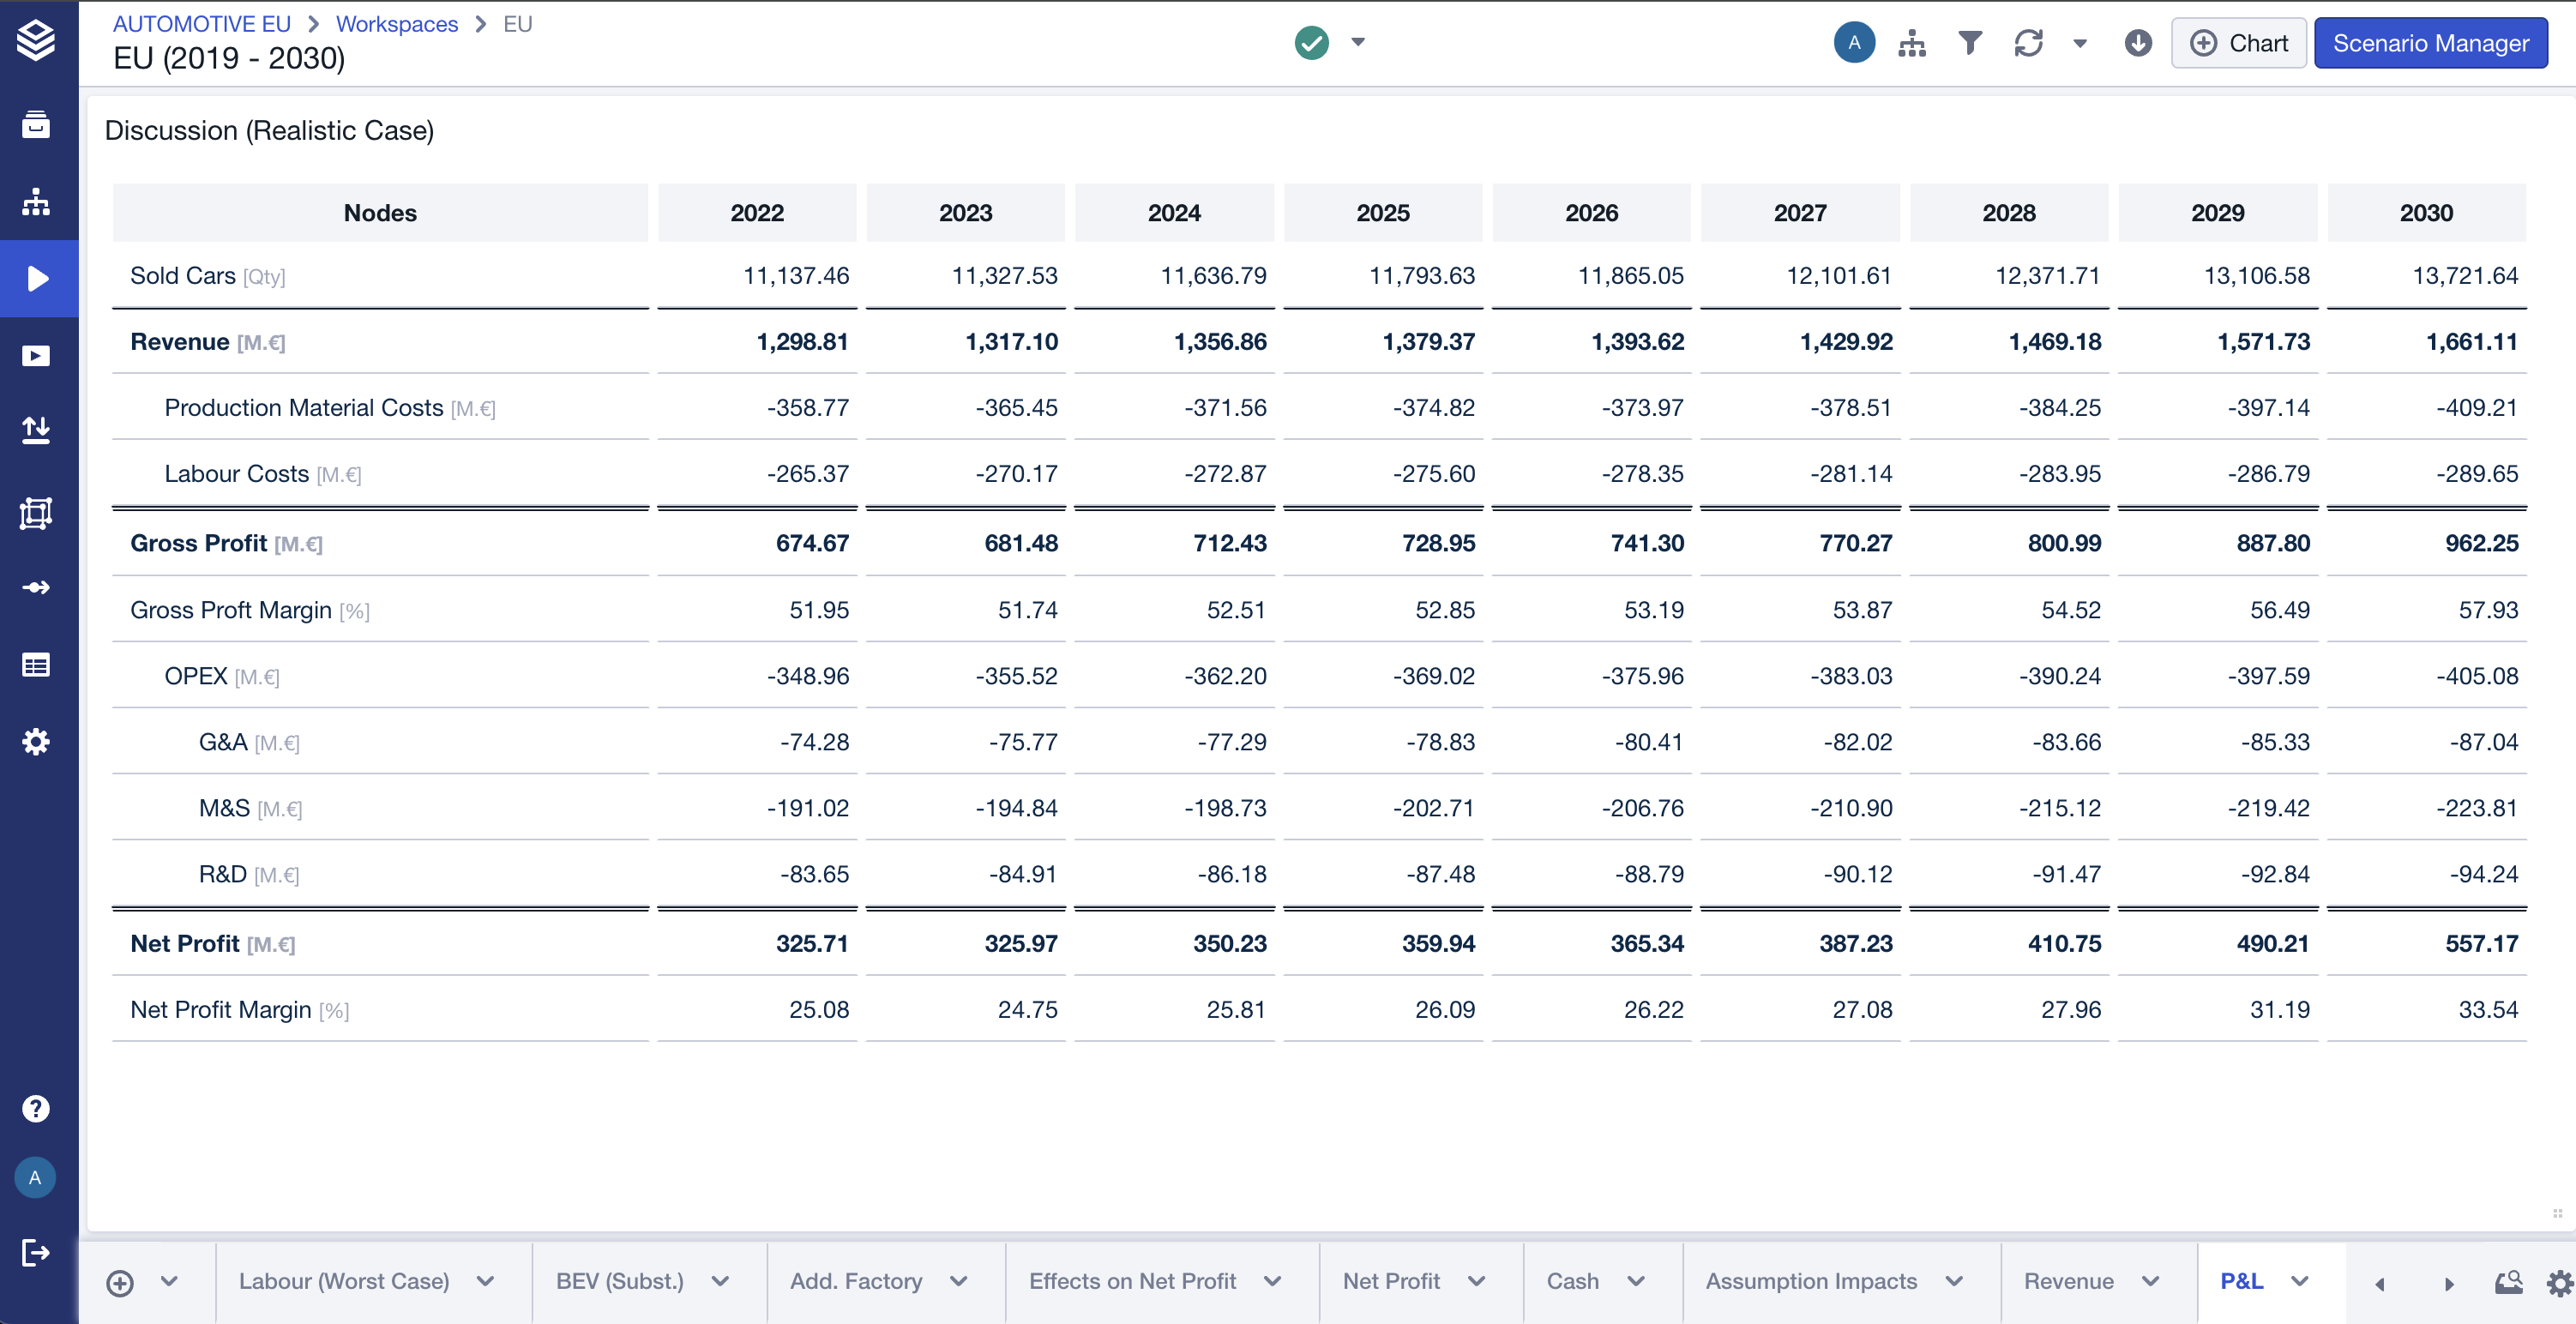
Major design improvements to our tables
Resizable columns for grid charts
Revised workflows for easier collaboration and consolidation
Improved submission of workflows for individual contributors
New formula: Enumerate
Improved Chart Formatting and Readability
We have introduced the first additions to make chart formatting more powerful and customisable than ever before. The new formatting options are designed to make charts easier to read, allowing you to focus on the numbers and data series you want:
Improved number readability
Many new settings to adjust the visibility of numbers to your liking
Improved visibility and formatting options for low contrast numbers
Hide values and allow overlapping for more number visibility control
Instance-wide dynamic font size setting

Find the full documentation on all formatting options here.
Improved Table Charts
Our table charts have been given a style update with a modern new format. Apart from the default design, we allow modification for the following features:
Default grid line colour changed to white
Default background colour
Horizontal gridlines
You can now change the column widths and persist them so that you always see the column width you set.
Manually: Drag the columns to the desired width. This column can only be resized by manually changing it again. This means that manual changes to other columns will not affect this column.
Automatic: A column that has never been resized. This column is resized depending on whether other columns have been resized, to keep the table as close to 100% of the container as possible.

Revised Workflows
We have made several improvements to our workflow for administrators and managers. It is now easier to create, manage and participate in workflows through revised guidance, a more intuitive interface and several improvements to the way workflows work. The improvements include:
Revised homepage and new tabs for easier navigation
Easier and faster to set up workflows and workflow steps
More flexibility with the ability to demote steps that have already been set to 'Done'.
Reworked Import and Submit Workflow Flow
We have also significantly improved the workflow for individual contributors and one-time users with an improved notification system, an intuitive import and submission process and revised documentation:
Improved workflow import and submission process for individual contributors
Notification system for available workflow steps
See here the new workflow documentation for admins and for individual contributors.
Further Improvements
New formula - Enumerate: Iterates through the values of the specified levels, returning each value with a number assigned in ascending or descending order according to the order in the Dimension Manager.
New formula - Fillmissing_last: Fills any missing level values using the last available value from the specified dimension in the input node.
Included German number format for data preview to make copy & pasting flows faster.
Two GDPR enhancements:
Automatic deletion of personal data
List of personal data
Duplicate and rename line-item variants.
Dynamic font sizes based on break points.
‘No template’ is the new default for node selection for creating scenario exports for a faster creation process.
‘Add unmatched level values’ is the new default for autodims setting.
For detailed information on these features and more, visit our documentation.
Happy Simulating!
