
Release Notes 6.0.0
Valsight 6.0 introduces major and minor changes to the UI and to functionalities. The following list provides a broad overview of where these changes were made:
Integration of a new overall user interface
Implementation of a new chart editor
KPI charts
Enable parallel working in the workspace
Development of the new ROLLFORWARD_ADVANCED
Sheet filter in the workspace
New configuration of totals in charts
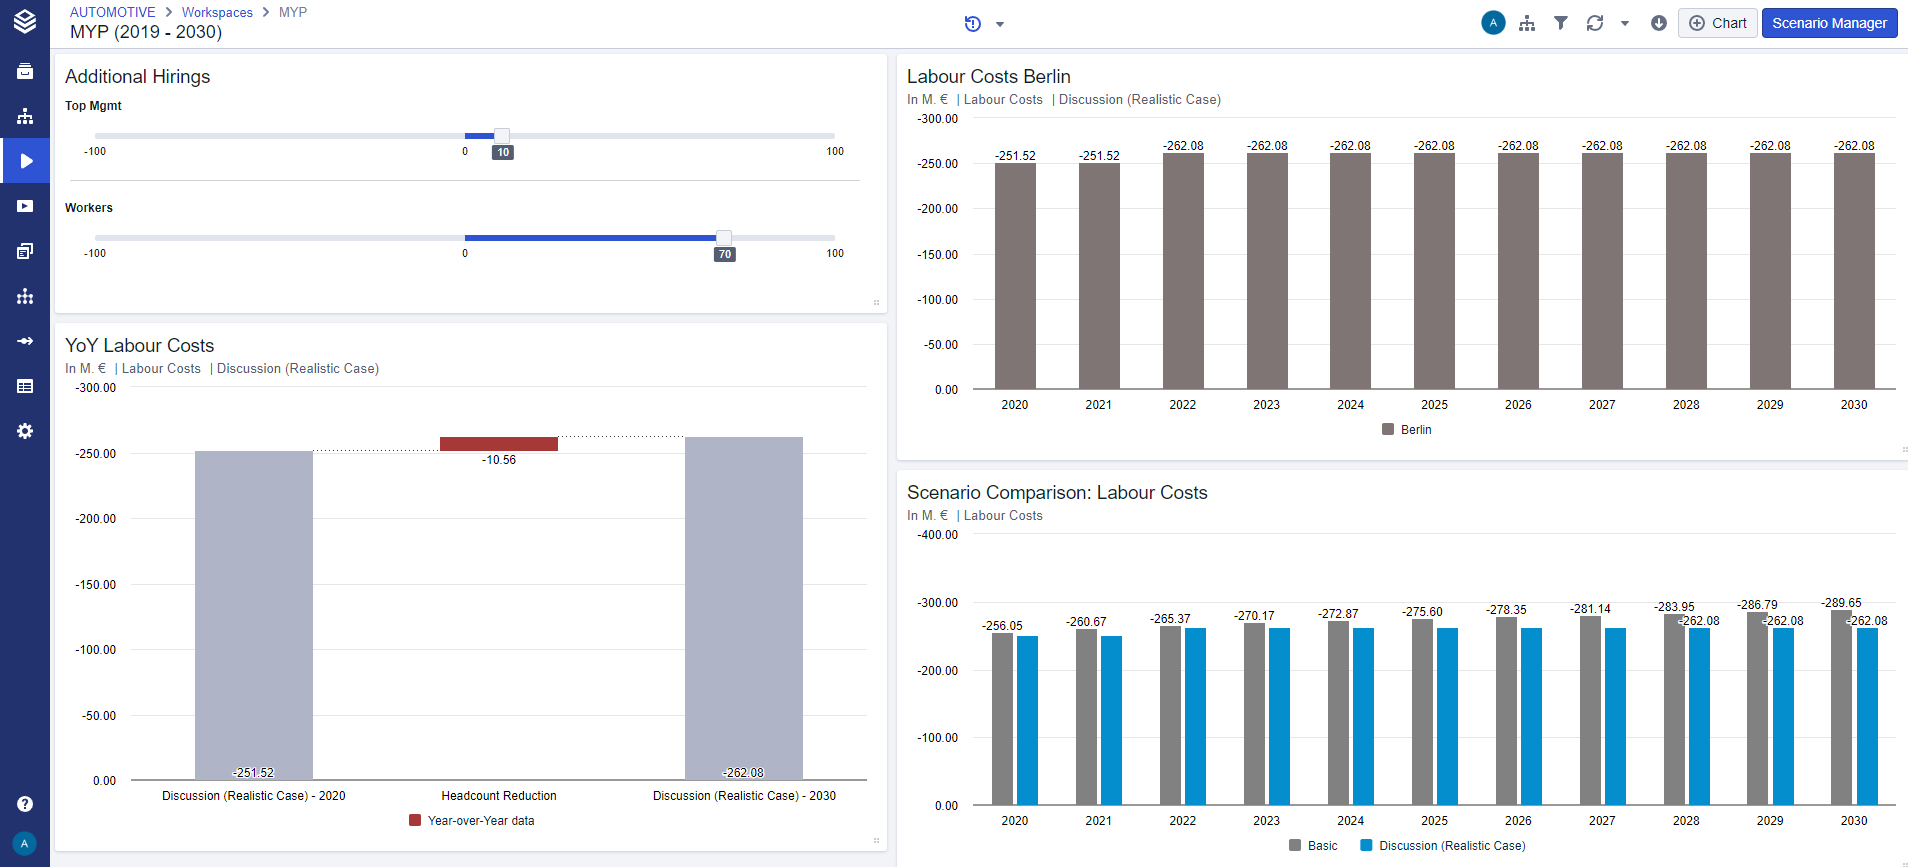
Slider tiles for worksheets
Highlight mode for charts
Scenario default for data preview
New way for model & workspace settings
Simplifying the line-item settings
User Interface
With Valsight 6.0, the interface of Valsight gets a major update. By implementing a new framework to build our user interface, the overall look of Valsight gets a new, modern design.
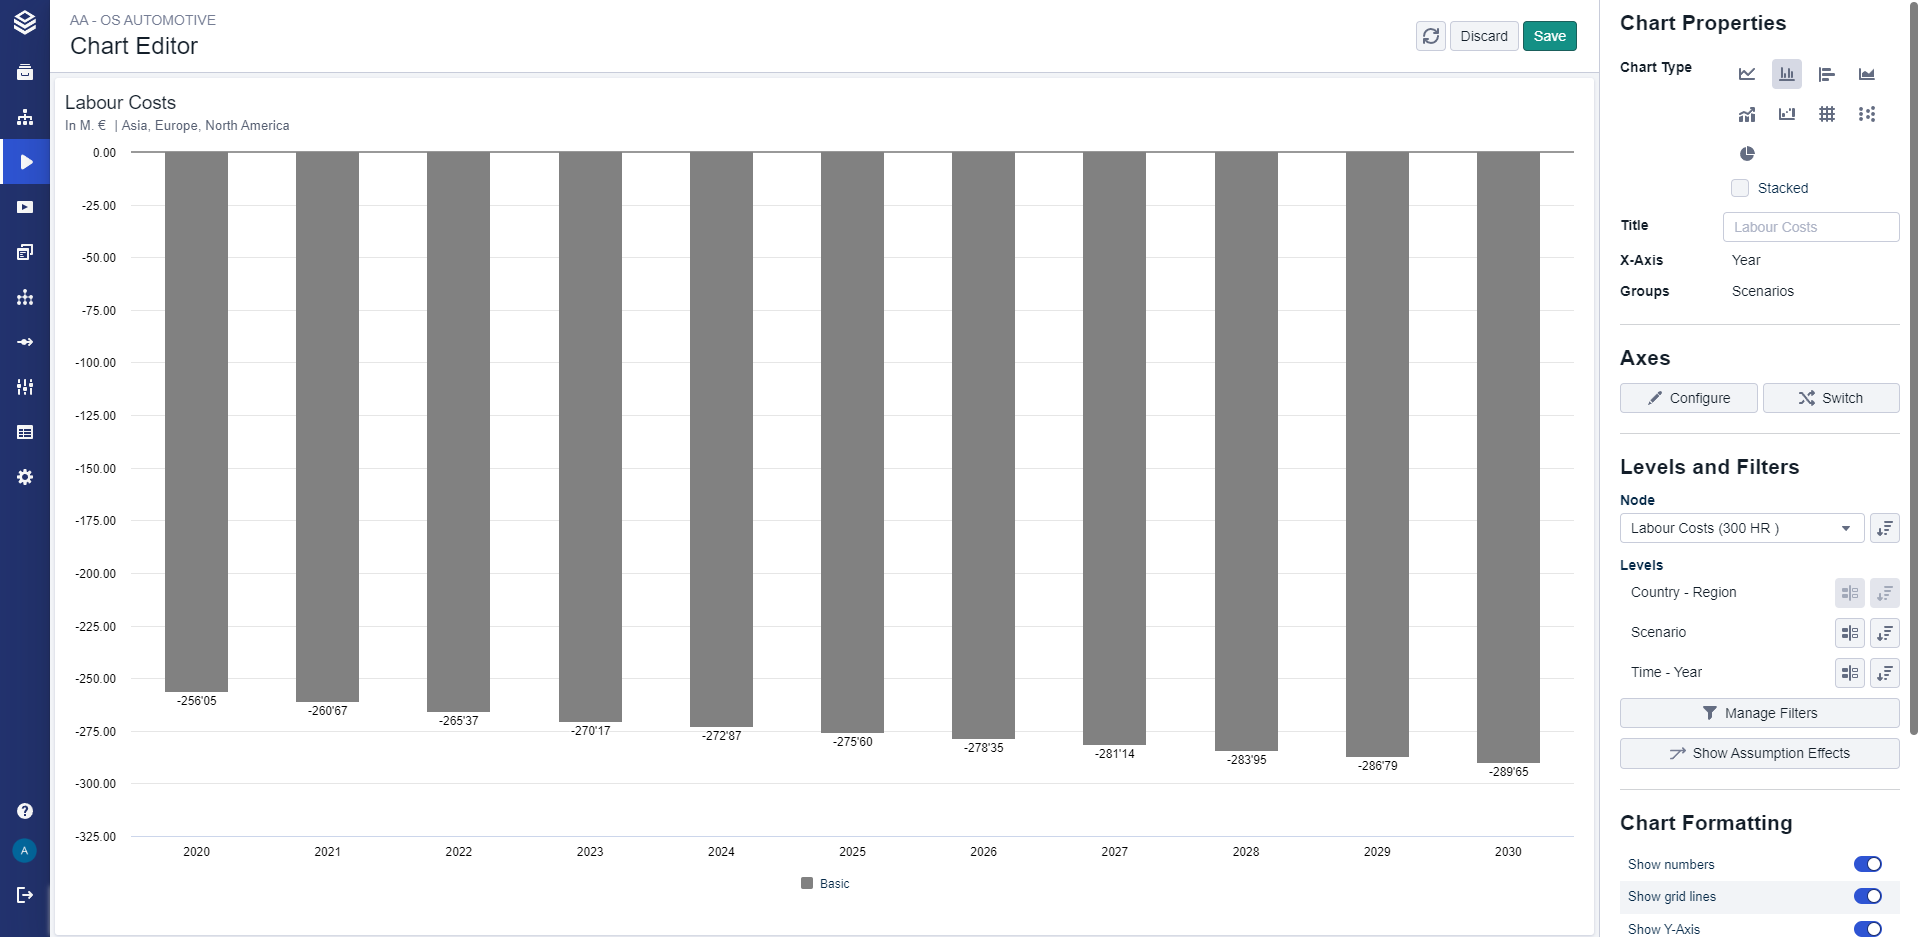
Chart Editor
With this update, an overhauled chart editor is introduced. This new chart editor was developed based on state-of-the-art research and best practices across the industry.
By implementing a full-screen preview mode that immediately shows the changes made in the settings, you are now able to edit your charts and try different configurations without the risk of missing your initial configuration
To improve the user experience while working with the chart editor, we rearranged the available settings within the editor to enable a more intuitive configuration process
A more detailed documentation for this can be found here.
KPI Charts
With this release, a new chart type has been implemented: KPI chart.
This chart allows you to highlight KPIs at first glance while also displaying a comparative value.
More information on the different chart types and their functionality can be found here.

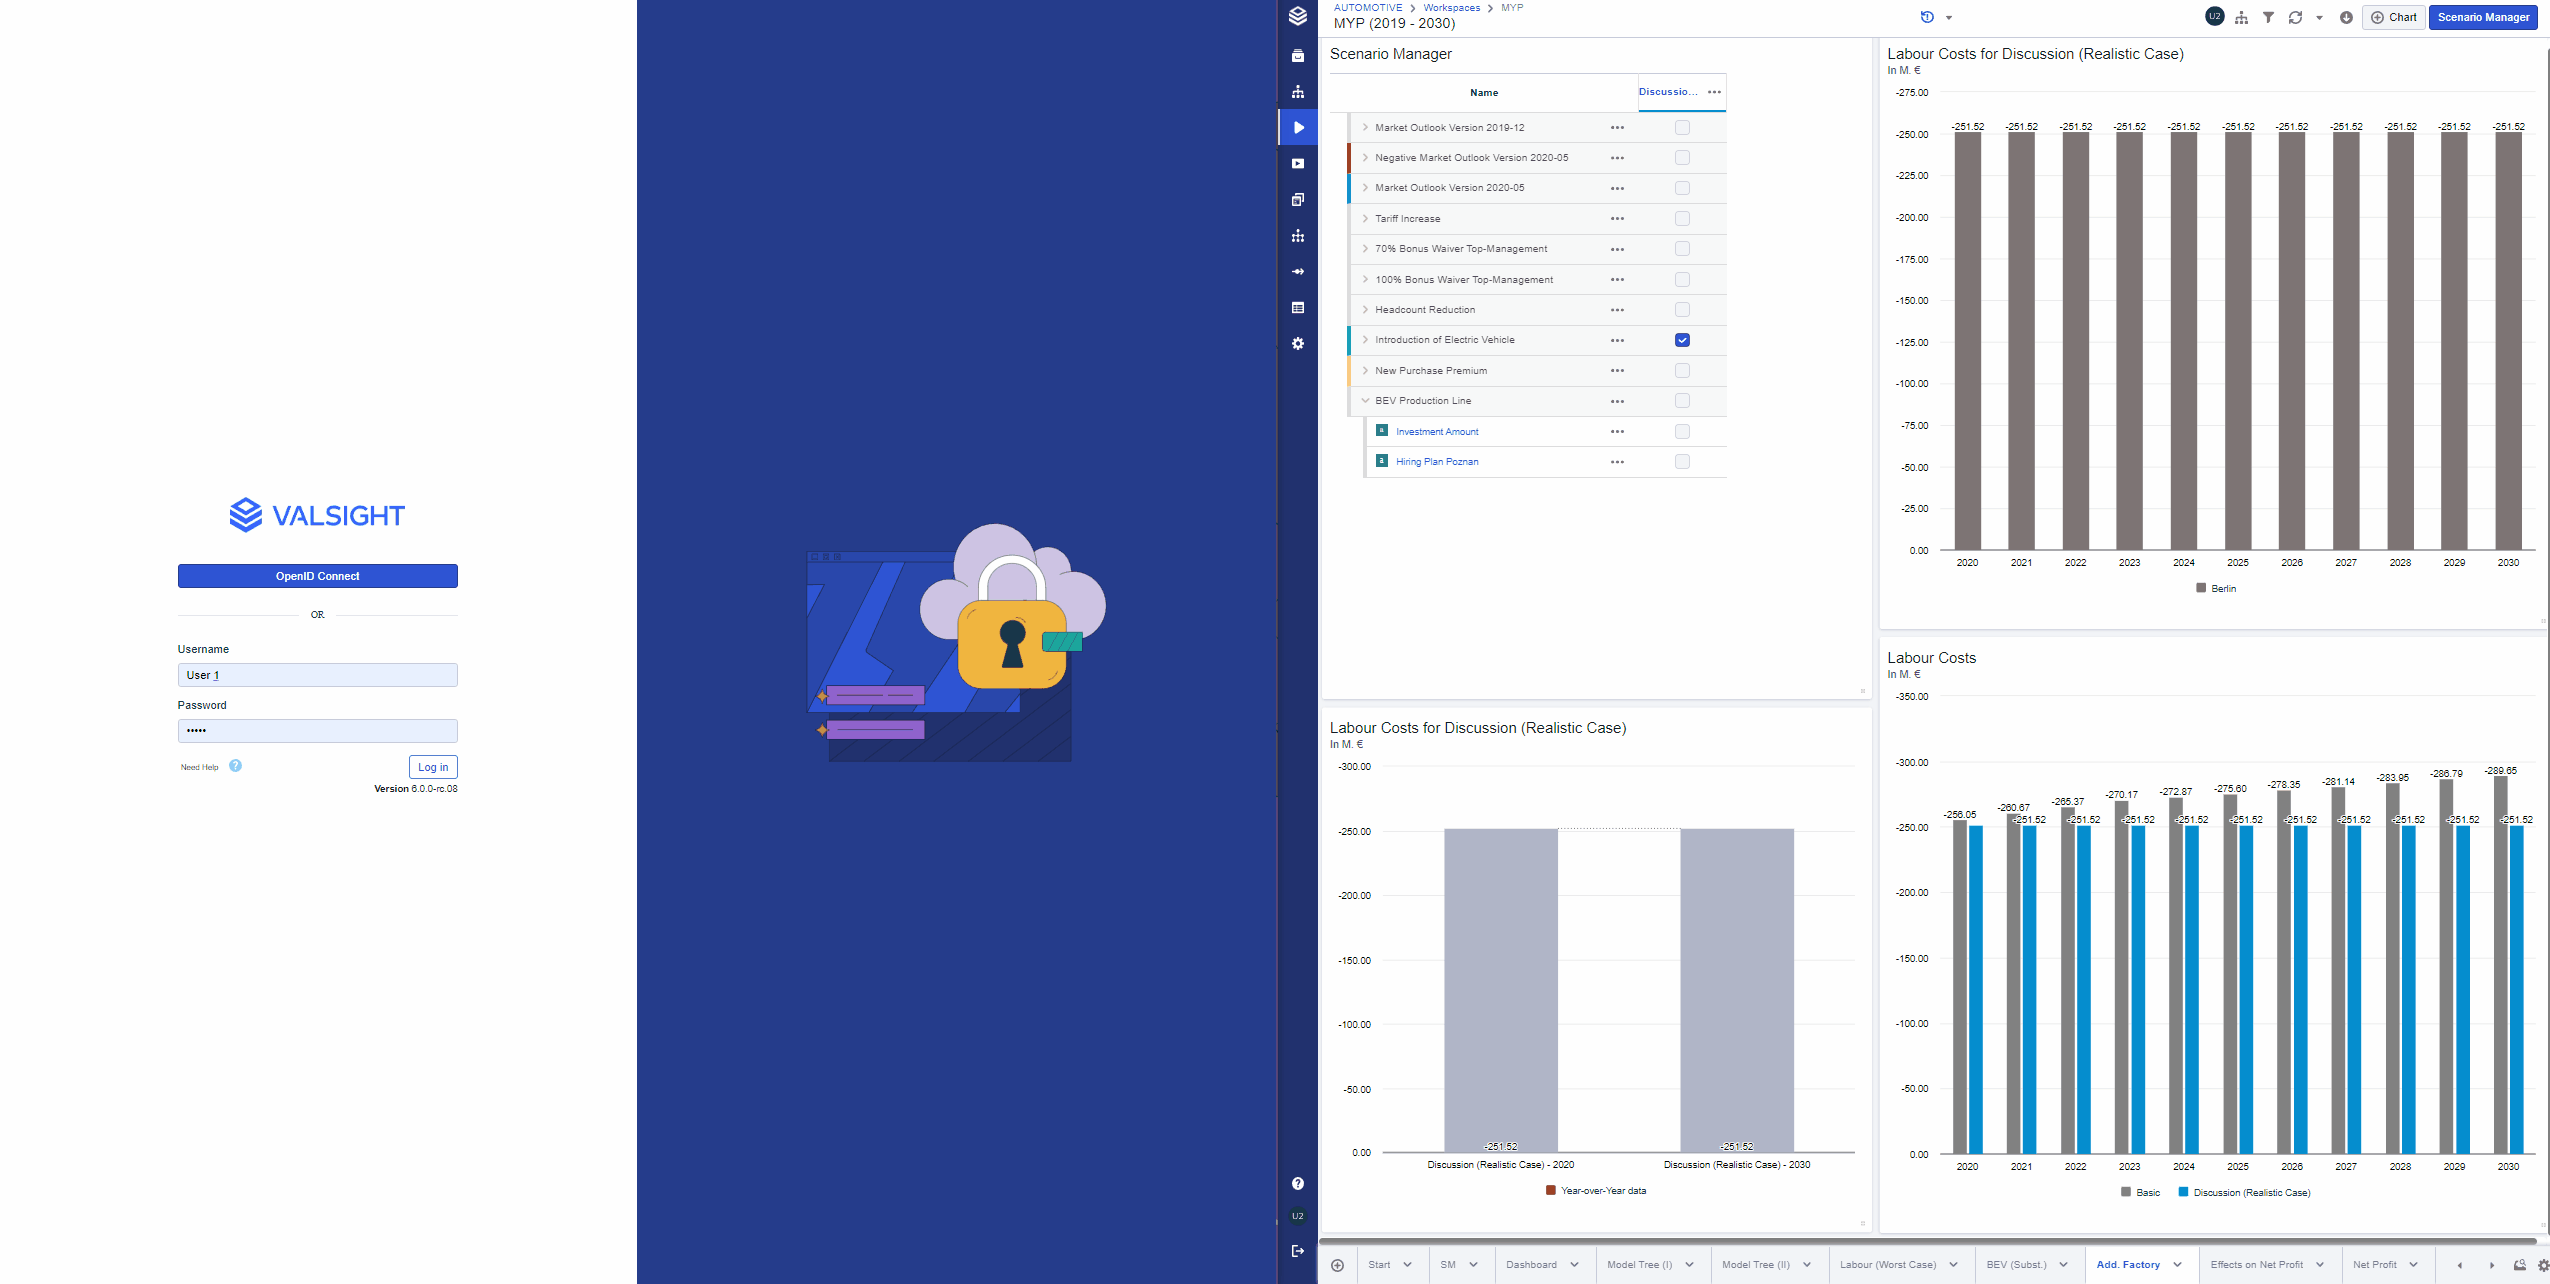
Parallel Working in the Workspace
Valsight 6.0 implements the functionality to work in the same workspace with multiple users simultaneously.
From now on, multiple users can enter the workspace at the same time and work together on sheets and the Scenario Manager while seeing the changes of other users live
While working in parallel, users are able to see what other users are in the workspace via a small list of icons in the header bar
This feature also allows you to enter the workspace in two separate tabs with the same account and eliminates the need for multiple workspace copies
A more detailed documentation for this can be found here.
ROLLFORWARD_ADVANCED
With Valsight 6.0 the ROLLFORWARD_ADVANCED introduces a major advancement in configuration options, use cases and performance optimizations compared to the current ROLLFORWARD.
By implementing a number of new parameters in the formula, the ROLLFORWARD_ADVANCED is able to easily support use cases of, for example projecting seasonality, contract aging, forecasting only a certain period or compound interest effects.
Additionally, the ROLLFORWARD_ADVANCED enables users to implement a custom parameter order instead of following the standard parameter order.
More information can be found in the table below or here.
Description | The ROLLFORWARD_ADVANCED allows to project a node into the future with a list of provided drivers, both relative and absolute. The function has optional parameters: index levels, which are incremented/shifted on each loop of the projection; the setting of start and end values for the projection; window settings that allow a selection of previous values to be used for a loop calculation, its aggregation level, and a shift type. This function combines the functionalities of both the ROLLFORWARD and the ROLLFORWARD_MUL. Differentiating between the mode of how drivers are applied can be done via the “mode” option in the formula. |
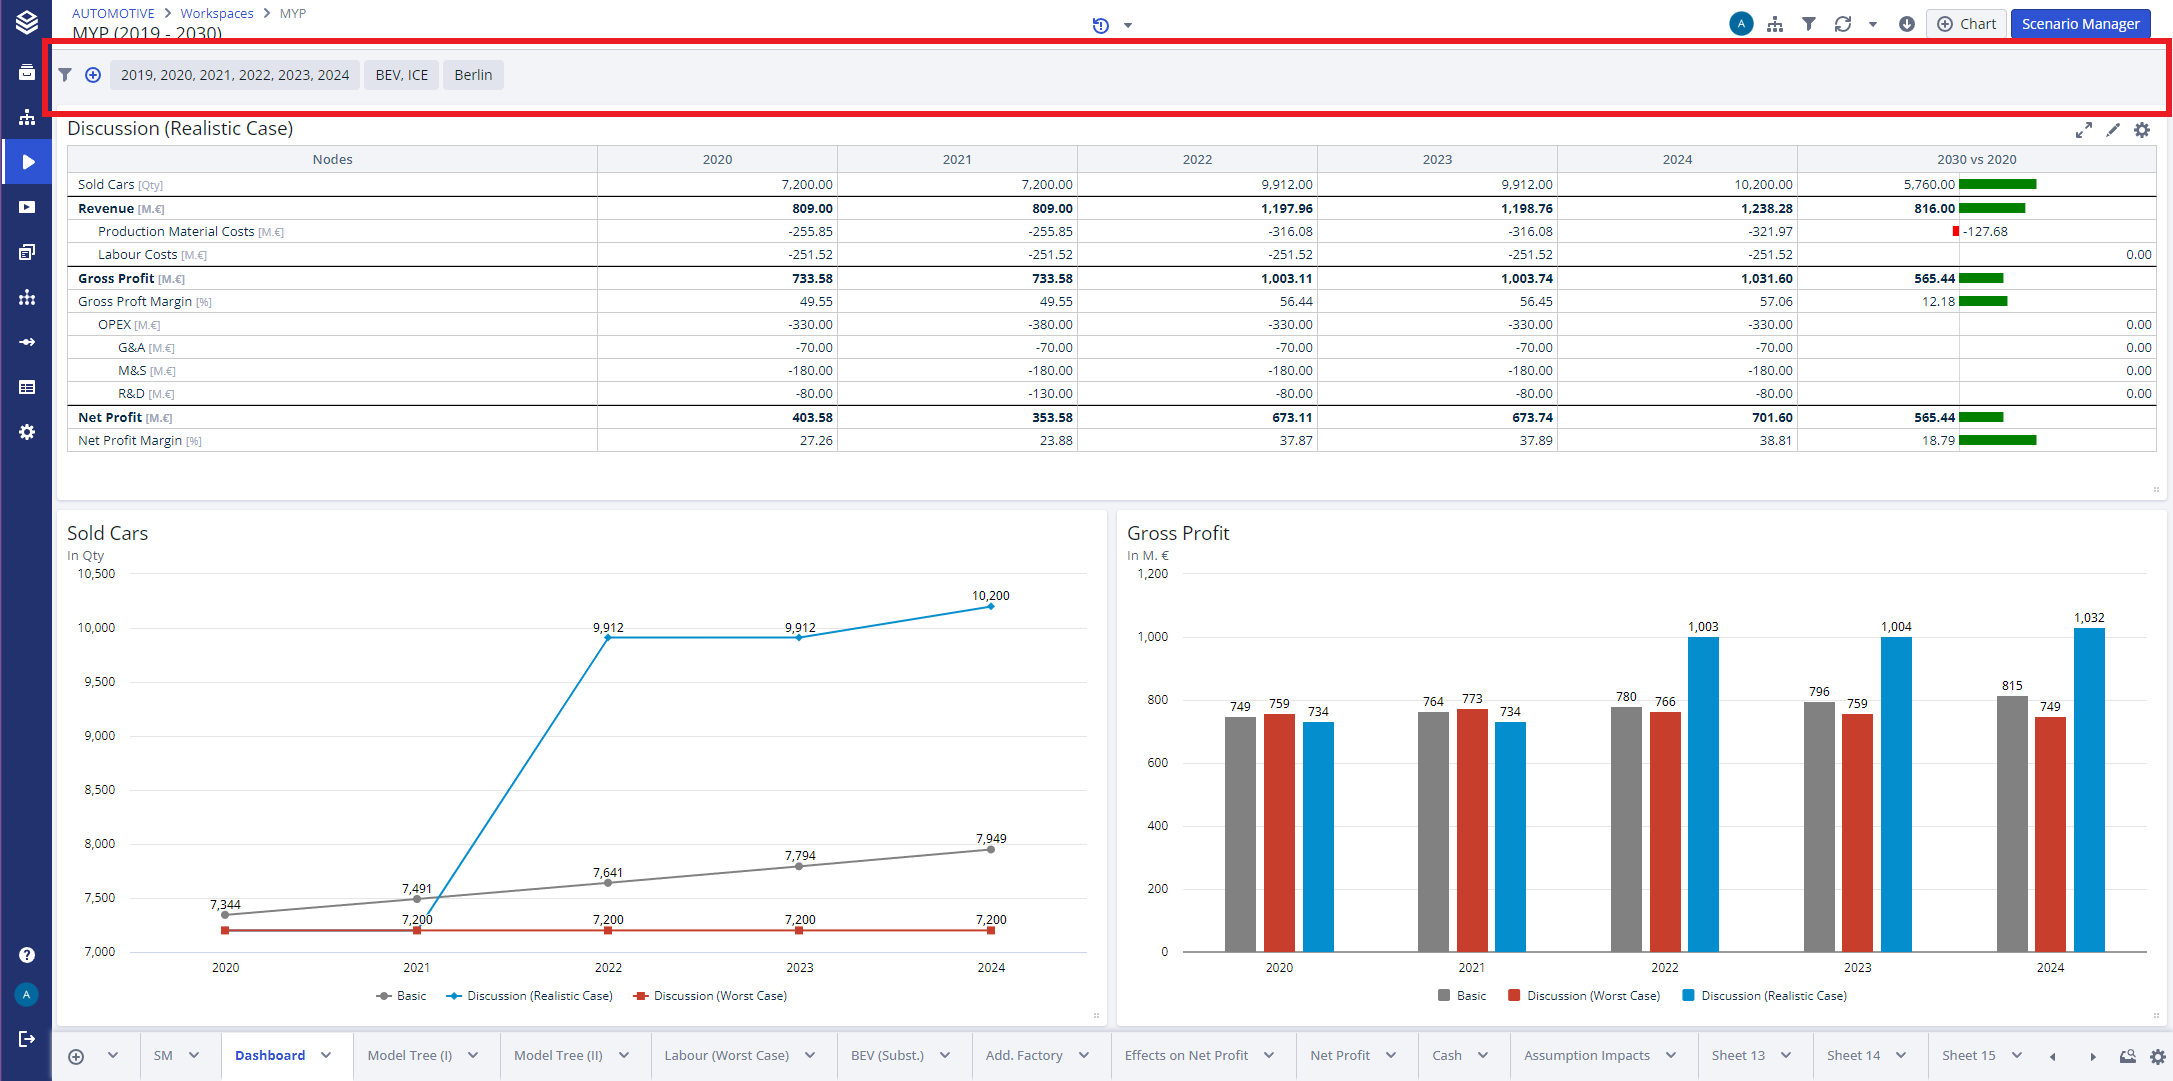
Sheet Filter
Valsight 6.0 adds sheet filters to the already available filter possibilities.
This allows users to apply filters to an entire sheet in a workspace.
That enables sheets to have different filters and therefore different focuses per sheet.
Additionally, this allows users to adjust the data shown per chart without the need to edit every chart manually.
For more information about different types of filters in a workspace, please visit the workspace documentation.
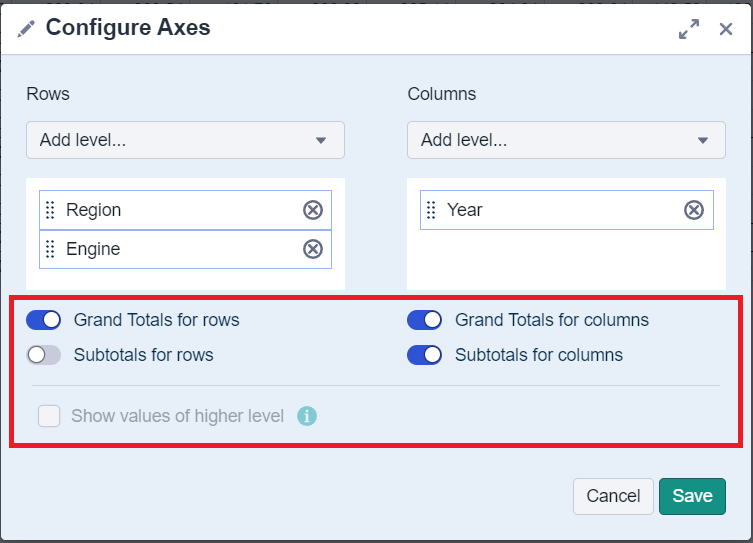
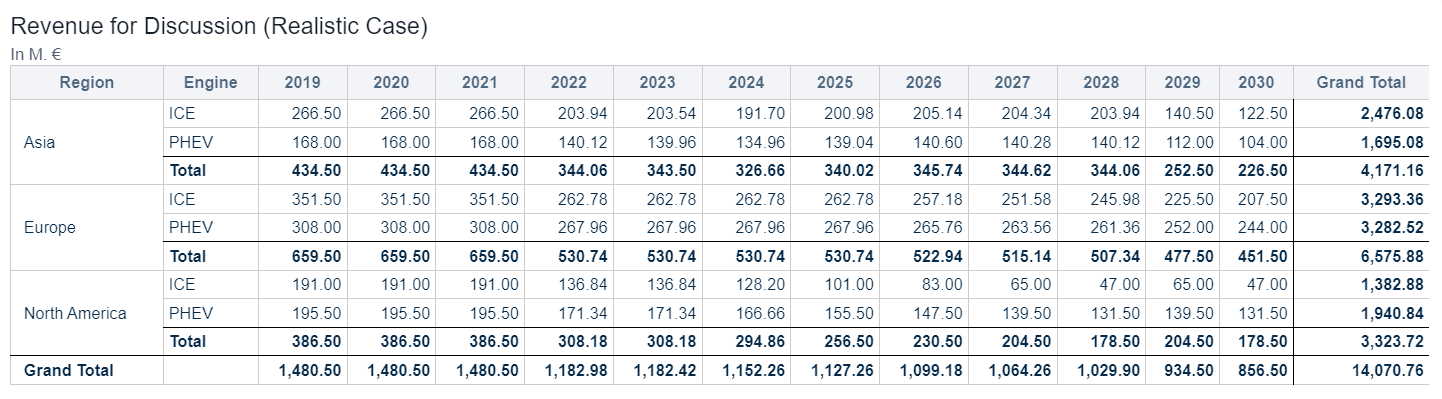
Totals Configuration
Valsight 6.0 implements an advanced totals configuration that adds subtotals to the configurable settings.
Users can now set subtotals and grand totals separately for each chart.
Furthermore, Valsight enables users to insert a total which ignores set filters. With that functionality you can for example filter your table to the first quarter of a year, but still see the total for all four quarters in the same chart.
More information about configurating and pivoting data in charts can be found in the documentation.
Slider Tiles
With this release, Valsight introduces the opportunity to display single or multiple sliders in tiles on your worksheet without having to insert the entire Scenario Manager.
This enables faster and more focused ad-hoc simulations. Compared to adding the entire Scenario Manager to your worksheet, single slider tiles take much less space and do not show other line-items or scenarios.
To learn more about sliders or how to visualize data in charts, please visit our documentation.
Highlight Mode for Charts
To simplify the process of presenting charts within your dashboard or highlighting charts, Valsight 6.0 enables users to show charts in a full screen mode while not entering the chart editor.
By opening the chart is this full screen mode, a temporary focus of attention can be directed towards one specific chart without seeing any edit options or other distractions.
More details about workspaces and its functionlities can be found here.
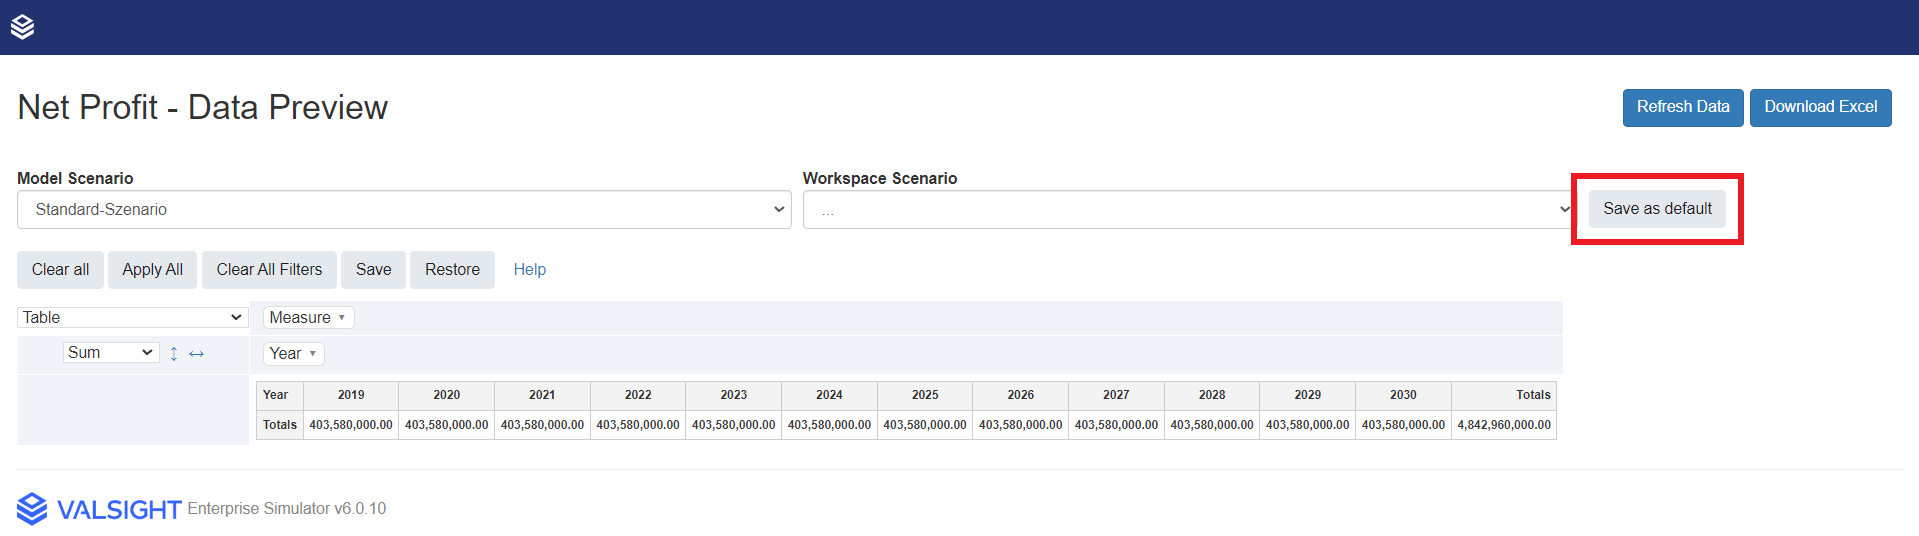
Scenario Default for Data Preview
With this release, users are able to select a scenario as the default selection for the data preview.
This default scenario is saved per user for the entire project.
Model & Workspace Settings
When editing an existing model or workspace, the settings no longer open on the right side of your screen. From now on, a dialog opens that inherits all the settings that can be adjusted. This dialog enables a more condensed and guided view onto the settings of a model or workspace
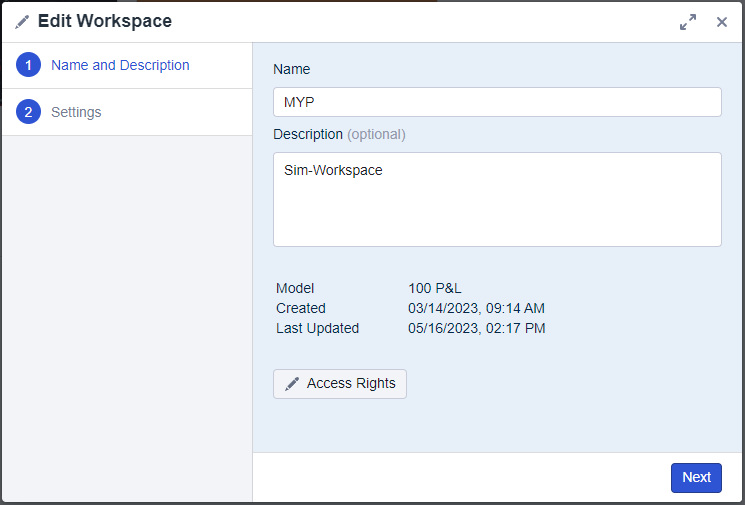
A more detailed documentation for this can be found here.
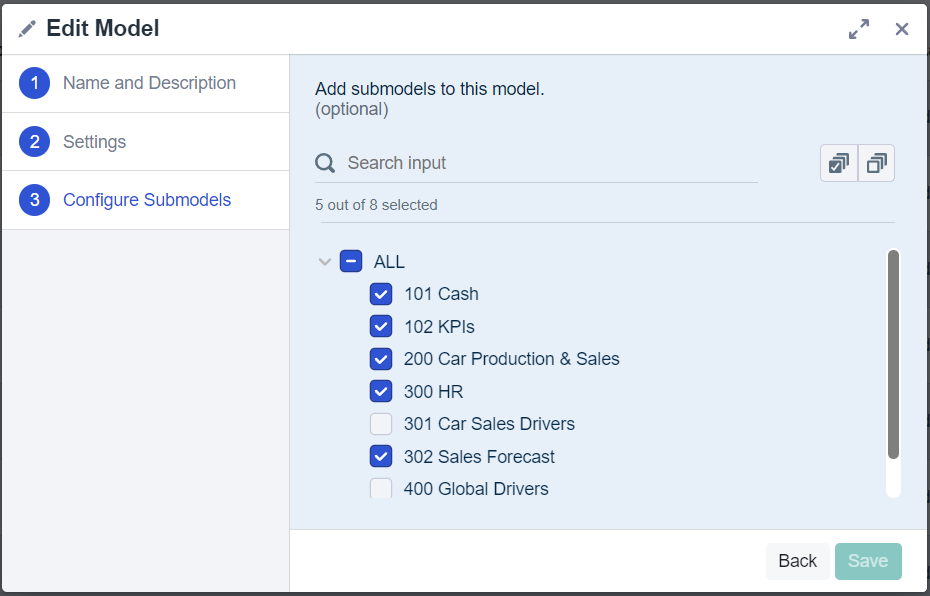
Submodel configuration
The submodel configuration for models is no longer opened via a separate button but is now also inherited in that new dialog and can be reached by opening the settings of a model.
Line Items
Valsight 6.0 changes nothing about the basic concept of line-items but brings in some improvements in creating and (re)configuring line-items.
A more detailed documentation for this can be found here.
Creating Line Items
With Valsight 6.0 it is now possible to select between an absolute line-item and a relative line-item. Relative line-items were previously known as line-items with a relative data entry.
After selecting either of these, creating a line-item will only require a node and a name to be ready to be activated in the Scenario Manager.
Detail vs Data View
To provide a slimmer and easier-to-understand overview of the details of a line-item we combined the previous “Reconfigure” menu with the “Details” menu into one page. The information of both pages can now be found together on the line-items detail page.
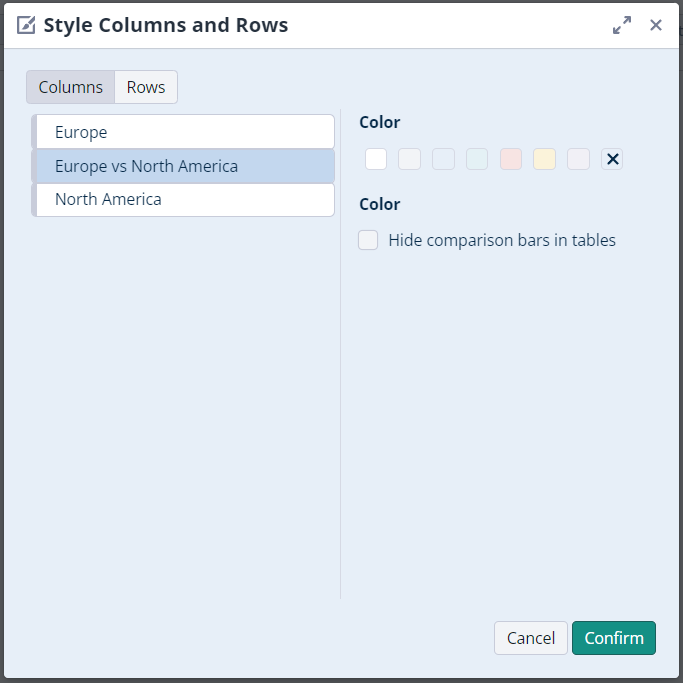
Formatting of Columns and Rows
Valsight 6.0 enables more custom formatting for the levels in a chart.
Via the chart editor, users are now able to assign colors to the values in your columns for better differentiation or highlighting.
Additionally, it is now possible to hide the comparison bars in charts.
OData Export for Charts
To enable easier collaboration between Valsight and other software, the 6.0 release implements the option to export charts via OData. This functionality can be found under the export options of each chart.
For more information about imports and exports within Valsight, click here.
Formulas
NONSIM
Description | The NONSIM function returns the value for the inserted node with no assumptions applied. All nodes that affect this input node will have assumptions applied. |
Signature | NONSIM(Node [, useVariablesFrom]) |
Parameters |
|
Limitations |
|
BASELINE
Description | The BASELINE function returns the value for the inserted node with no assumptions applied, as well as all nodes that affect the input node have no assumptions applied. |
Signature | BASELINE('Node' [, useVariablesFrom]) |
Parameters |
|
Limitations |
|
User Authentication - Single-Sign-On
With Valsight 6.0 the configuration for the SSO options have been adjusted.
These adjustments affect the common SSO options (SAML, OpenID Connect).
The new configurations can be found here.
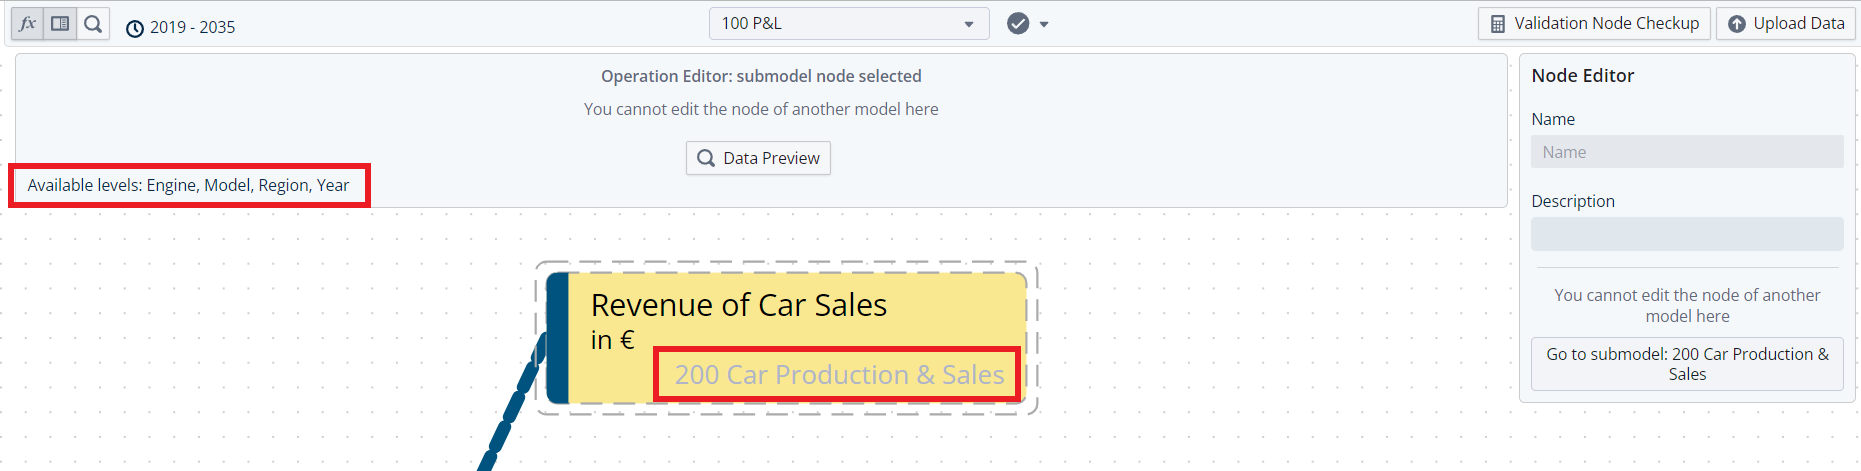
More Information on Submodel Nodes
With the new release, more information about submodel nodes is provided in the model editor.
Every submodel now also indicates the name of the submodel and on-click also shows the available levels per node.
Further Improvements
External CSV URLs can now also be used to create data sources in Valsight
Users can now select colors for imported scenarios
Change the user type name from “Analyst” to “Basic User”
Feature Deprecation
With Valsight 6.0 some features have been removed from our software. These features are listed here: Feature Deprecations